
Fig. 4.
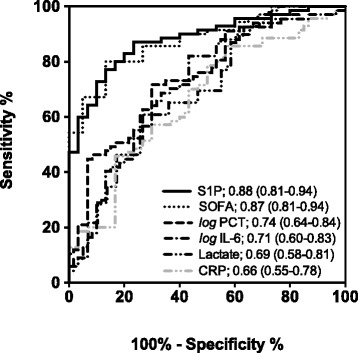
Receiver operating characteristic (ROC) curves for the prediction of septic shock. PCT and IL-6 have been transformed to log10 scale to achieve normal distribution. AUC area under the curve (95 % confidence interval), CRP C-reactive protein, IL-6 interleukin-6, PCT procalcitonin, S1P sphingosine-1-phosphate, SOFA Sequential Organ Failure Assessment score