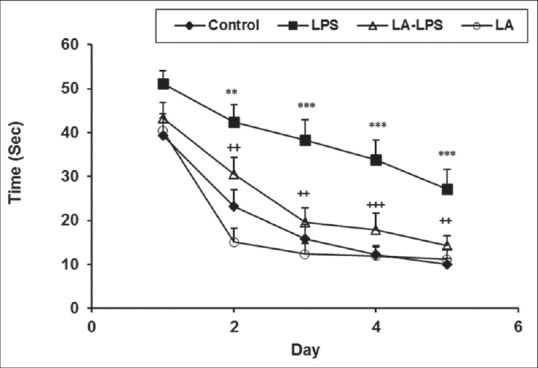
Figure 1.

Comparison of time latency to reach the platform in Morris water maze test between four groups. Data are presented as mean ± standard error of the mean (n = 8 in each group). The time latency of the lipopolysaccharide group was significantly higher than those of the control group whereas the animals of L-arginine-lipopolysaccharide group spent a less time to reach the platform than lipopolysaccharide ones. There was no significant difference between control, L-arginine-lipopolysaccharide, and L-arginine groups. **P < 0.01 and ***P < 0.001 compared with control group, ++P < 0.01 and +++P < 0.001 compared with lipopolysaccharide group
