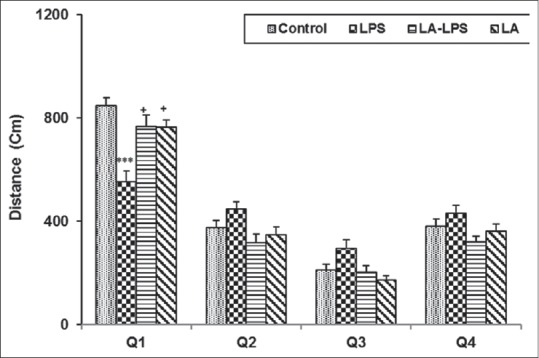
Figure 4.

The results of the traveled distance in target quadrant in probe day, 24 h after the last learning secession. The platform was removed, and the traveled distance in target quadrant was compared between groups. Data are shown as mean ± standard error of the mean (n = 8 in each group). ***P < 0.001 compared with control group, +P < 0.05 compared with lipopolysaccharide group
