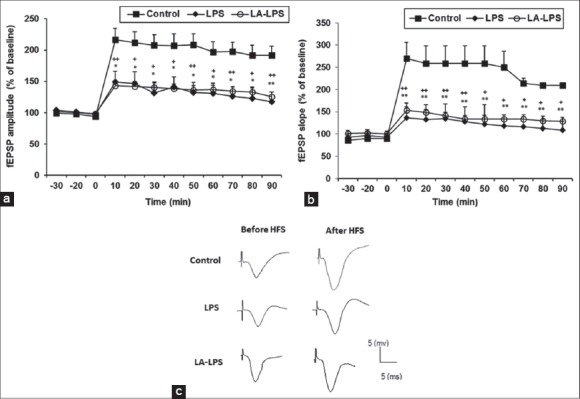
Figure 5.

The results of long-term potentiation induction in CA1 area of the hippocampus using 100 Hz tetanic stimulation at: (a) The field excitatory postsynaptic potential slope and (b) the field excitatory postsynaptic potential amplitude. Data are presented as the average percentage change from baseline responses. Each point shows mean ± standard error of the mean (n = 8 in each group). Slope and amplitude of field excitatory postsynaptic potential in lipopolysaccharide group (*P < 0.05 and **P < 0.01) and L-arginine group (+P < 0.05 and ++P < 0.01) were lower than control group. There is not any significant difference in slope and amplitude of field excitatory postsynaptic potential between lipopolysaccharide and L-arginine groups, (c) Single traces recorded before and after induction of long-term potentiation in CA1 area of the hippocampus
