
Fig. 8.
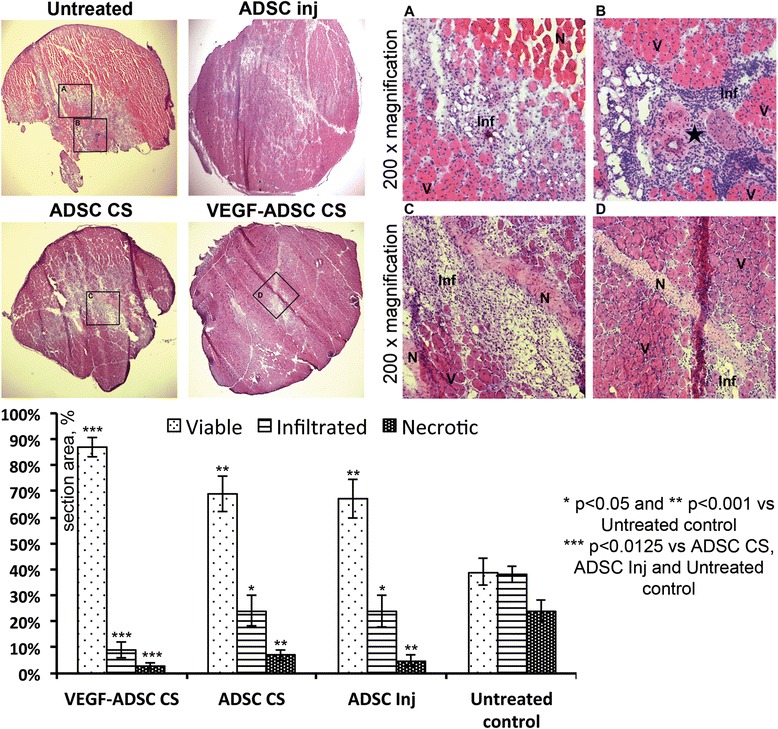
Reduction of skeletal muscle necrosis and infiltration after delivery of ADSC. Upper left – Whole-section images of hematoxylin/eosin-stained muscle from corresponding study group; Upper right (a-d) Microphotographs representing histological changes in areas outlined in the upper row. a Border area with necrotic fibers (N), inflammatory cells infiltrate (Inf) and viable tissue (V). b Artery-vein-nerve (star) complex with expressed inflammatory extravasation. c and d Fibrotic tissue on site of resolved ischemic necrosis. Lower row Graphic presentation of morphometry results; ANOVA and Student t-test with Bonferroni correction. ADSC adipose-derived stromal cells, ANOVA analysis of variance