
Figure 4. Cell Death Correlates with the Amount of Protein Aggregates.
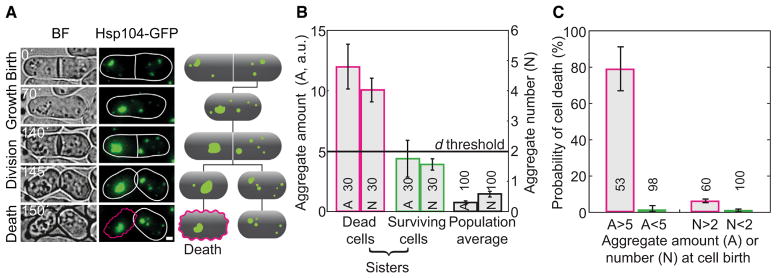
(A) Bright-field (BF) and fluorescence images of a strain expressing Hsp104-GFP, and the corresponding schemes. The cell with a large amount of protein aggregates died (magenta edge), while its sister survived (white edge). The scale bar represents 1 μm. The time is given in minutes.
(B) Aggregate amount (A, Hsp104-GFP intensity in arbitrary units, a.u.) and puncta number (N) for dead cells (magenta), their sisters (green), and the population (black).
(C) Death frequency in cells born with Hsp104-GFP intensity or aggregate number above (magenta) and below (green) the death threshold, d (d=5 a.u. for A, defined as three times the average of the population; or 2 aggregates for N, see B).
The data are means ± SEM. The number of cells from more than three independent experiments is given in the graphs. See also Figures S3 and S4 and Movie S3.