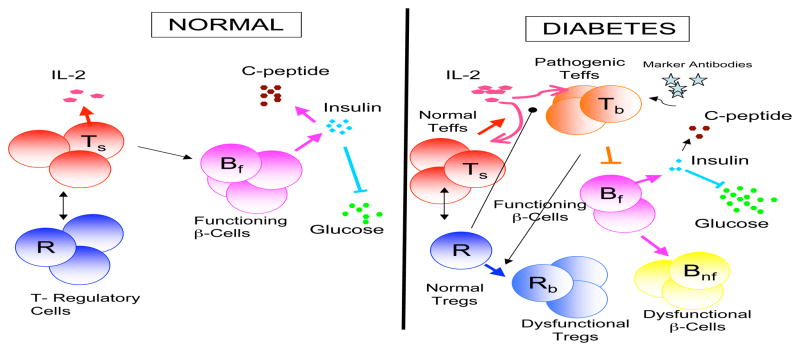
Fig. 1.
Diagram presenting the basic features of our model. The left side shows a normal individual and the right side shows a T1DM patient. For a normal individual there exists a healthy balance between the regulatory T cells, immune cells and functioning β-cells. The functioning β-cells produce insulin which then controls the levels of glucose. IL-2 is produced by the immune cells. The path to T1DM is shown on the right were we introduce two compartments, Rb and Tb, that show the model’s ability to track the changes in functionality and concentration of functioning β-cells, Bf, and regulatory T cells, R. We also show the islet autoantibodies which we hypothesis correlates in time with an increase in pathogenic T cells, Tb, that are attacking the functioning β-cells. Notice the resulting changes in the level of glucose and insulin.

