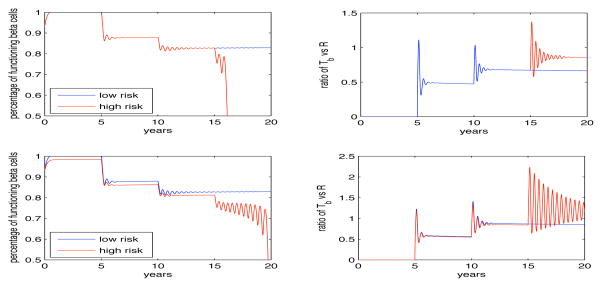
Fig. 3.
Important figure showing the model’s capabilities of simulating T1DM results. The mathematical model presented in this paper accounts for the functionality and concentration of regulatory T cells. The top two panels show the decline of functioning β-cells (left) and the ratio of pathogenic T cells to regulatory T cells (right) when we allow for the dysfunctional β-cells to regain some of their functionality (ε > 0). What we find is for low risk individuals (≤ 2 islet autoantibodies) that the β-cells decline between 10 – 15% over a 20 year period and the person remains in a pre-diabetic state. However if the person moves to high risk, i.e., > 2 islet autoantibodies, the β-cells begin to significantly decline and with-in three years drop to zero. The right panel shows the ratio of Tb vs R and how the regulatory T cells are trying to control the pathogenic T cells (through the quickly damped oscillations) but become too stressed after the third antibody appears (as seen by the sustained oscillations). The bottom set of panels show the same dynamics but when we do not allow for the return of dysfunctional β-cells (ε = 0). The significant difference we find is that after the appearance of the third antibody the β-cells decline with-in one year instead of three years but they do so while the regulatory T cells seem to be still controlling the pathogenic T cells (as seen by the ratio of Tb to R being less then one and hence the concentration of R is greater than Tb).

