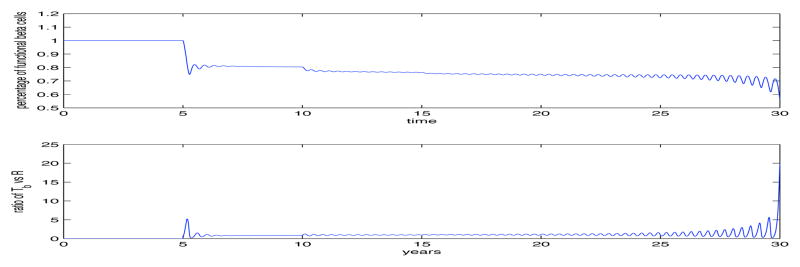
Fig. 5.

Figure similar to Fig. 4, except we change the values of αi and K by 20%, showing that the functioning β-cells can be predicted by the model to maintain a reduced level for over 20 years after we see the third islet autoantibody. Again, showing the model’s robustness to describe a wide variety of dynamics.
