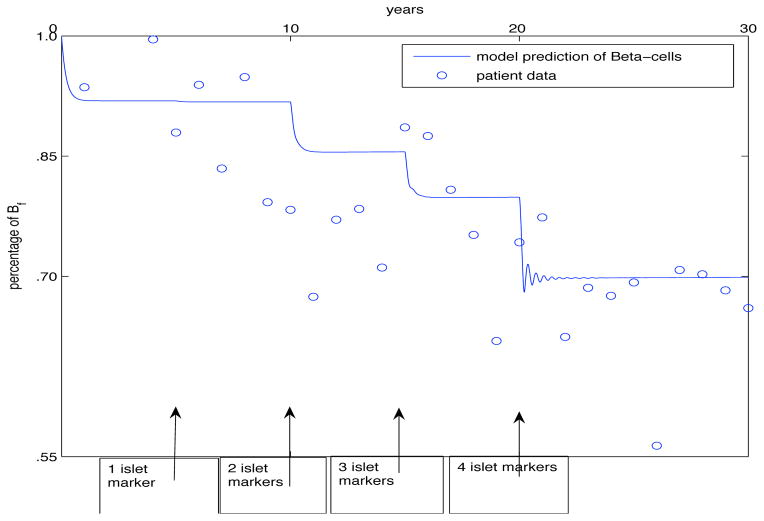
Fig. 7.
Now we consider the predictive ability of the model and show how it can be of use for understanding T1DM. The previous figures have focused on the model’s description of changes in β-cell numbers over time. In this figure, we generated a random set of data points that simulates the gradual decline of functional β-cells over a 30 year period of time. Keeping the model parameters fixed from before, we focused on the timing of the appearance of the islet autoantibodies in the pancreas. We assumed they appeared at 5, 10, 15 and 20 years, post start of the simulation, and then described the level of response the pathogenic T cells needed to fit the data. The equation we used was , where the H represents the heaviside (step) function. From our data set we were able to show an increase in the response of pathogenic T cells after the number of islet autoantibodies increase. As seen in Fig. 7 we used α1 = 10, α2 = 50, α3 = 100, and α4 = 150.

