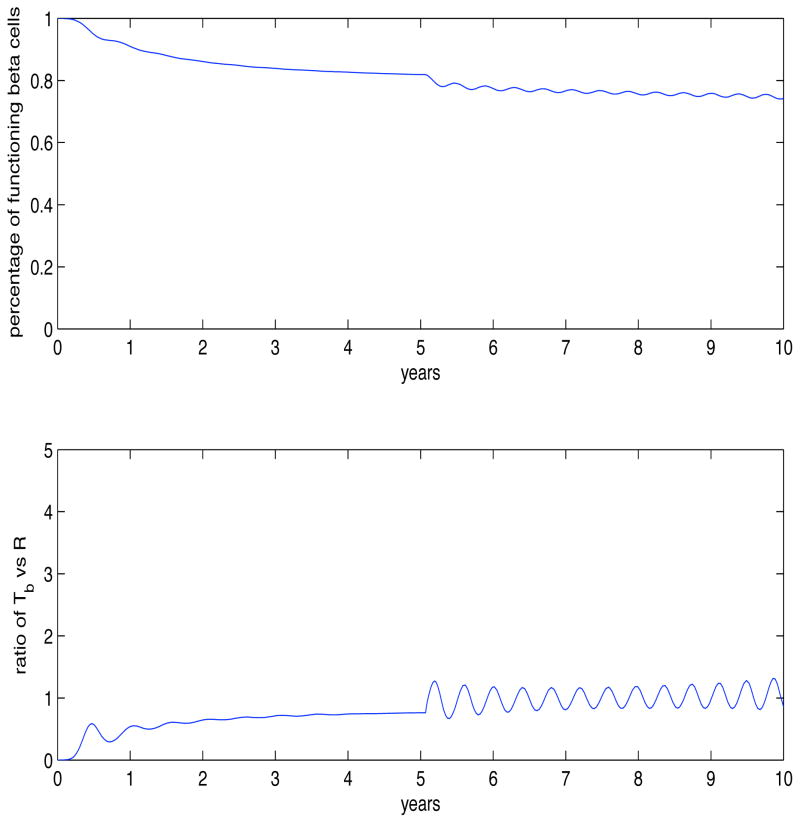
Fig. 8.
With modifications in our function, S(t), we can describe early events in the onset of T1DM in young adults. Top figure shows the gradual decline in functioning β-cells. The initial decline could be due to the subjects genetic disposition to the disease. Once T cell and autoantibody responses occur, we continue to see a decline in the number of functioning β-cells. In conjunction with this, we see the ratio of pathogenic to regulatory T cells (bottom figure) starting to oscillate about 1. With the proper adaption to experimental data, our model can help understand the complex dynamics associated with this disease.

