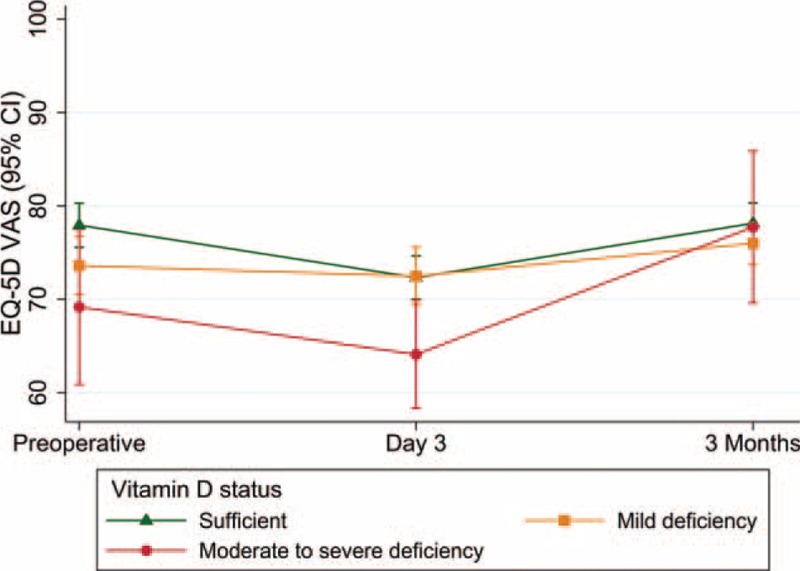
FIGURE 3.

Comparison of mean (95% confidence interval) EQ-5D visual analogue score over time by vitamin D status groups. Green triangle represents sufficient 25-OHD levels (50–220 nmol/L), orange square represents mild deficiency (30–49 nmol/L), and red circle represents moderate-to-severe deficiency (<30 nmol/L).
