FIGURE 1.

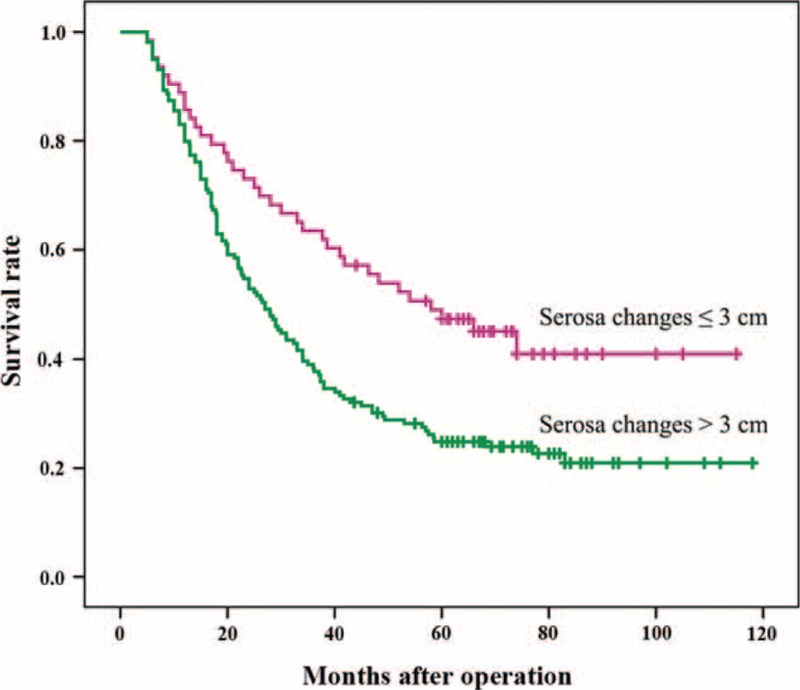
Kaplan–Meier curves of gastric cancer postintervention survival with indicated serosa changes at surgery. Horizontal marks (I) indicate censored values.

Kaplan–Meier curves of gastric cancer postintervention survival with indicated serosa changes at surgery. Horizontal marks (I) indicate censored values.