FIGURE 3.

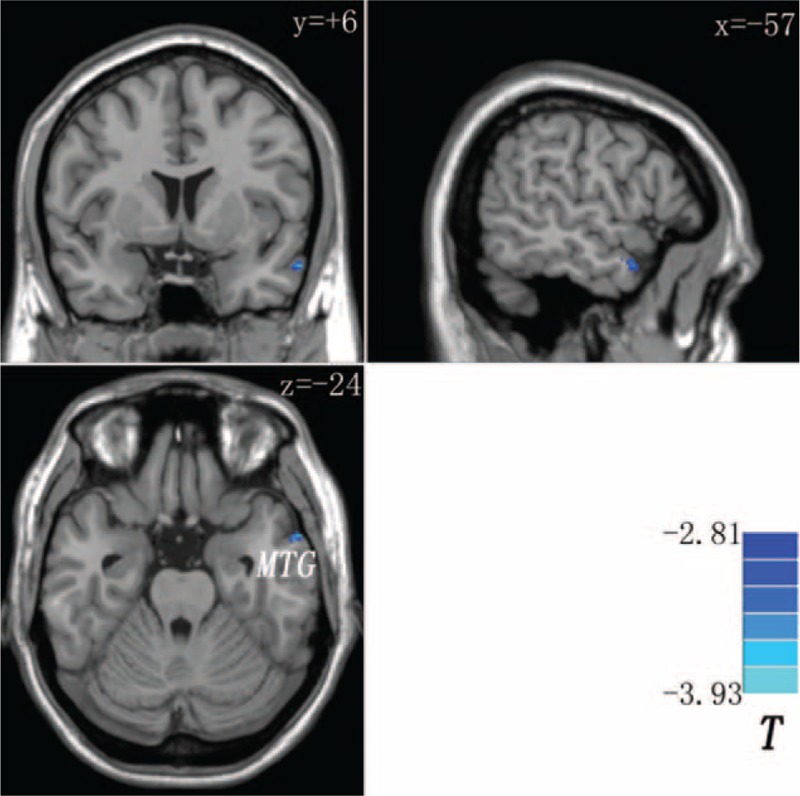
Decreased gray matter volume in the left middle temporal gyrus (MTG) in the combined group (patients and siblings) compared with the controls. The color bar indicates the T values from 2-sample t-tests.

Decreased gray matter volume in the left middle temporal gyrus (MTG) in the combined group (patients and siblings) compared with the controls. The color bar indicates the T values from 2-sample t-tests.