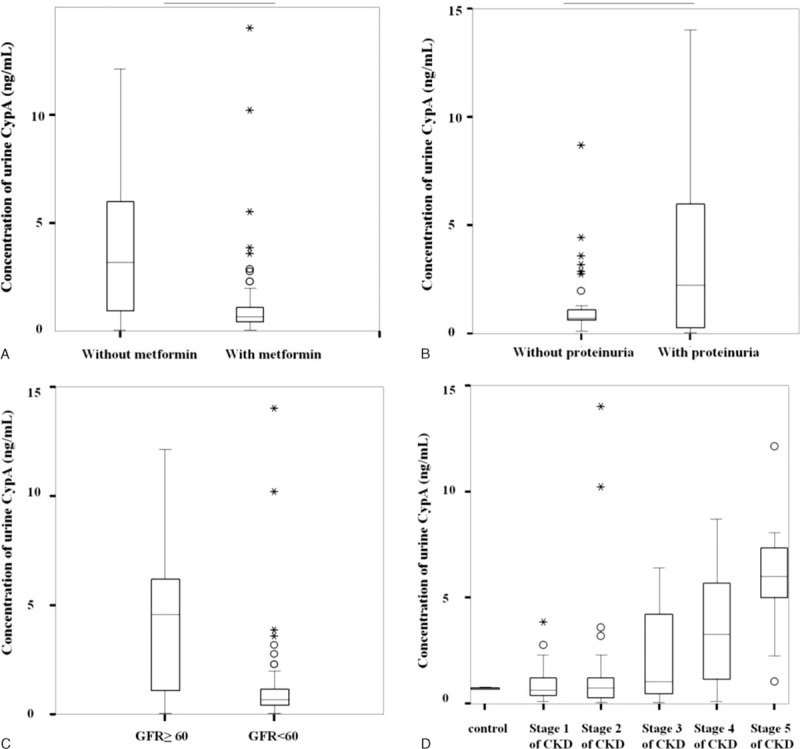
FIGURE 1.

Univariate analysis between clinical parameters and urinary CypA. P value for A was <0.001, for B was 0.007, and for C was <0.060. P value between stages 1 and 2, 2 and 3, 3 and 4, 4 and 5 of CKD were 0.511, 0.633, 0.365, 0.203, and 0.061, respectively. CKD = chronic kidney disease, CypA = cyclophilin A.
