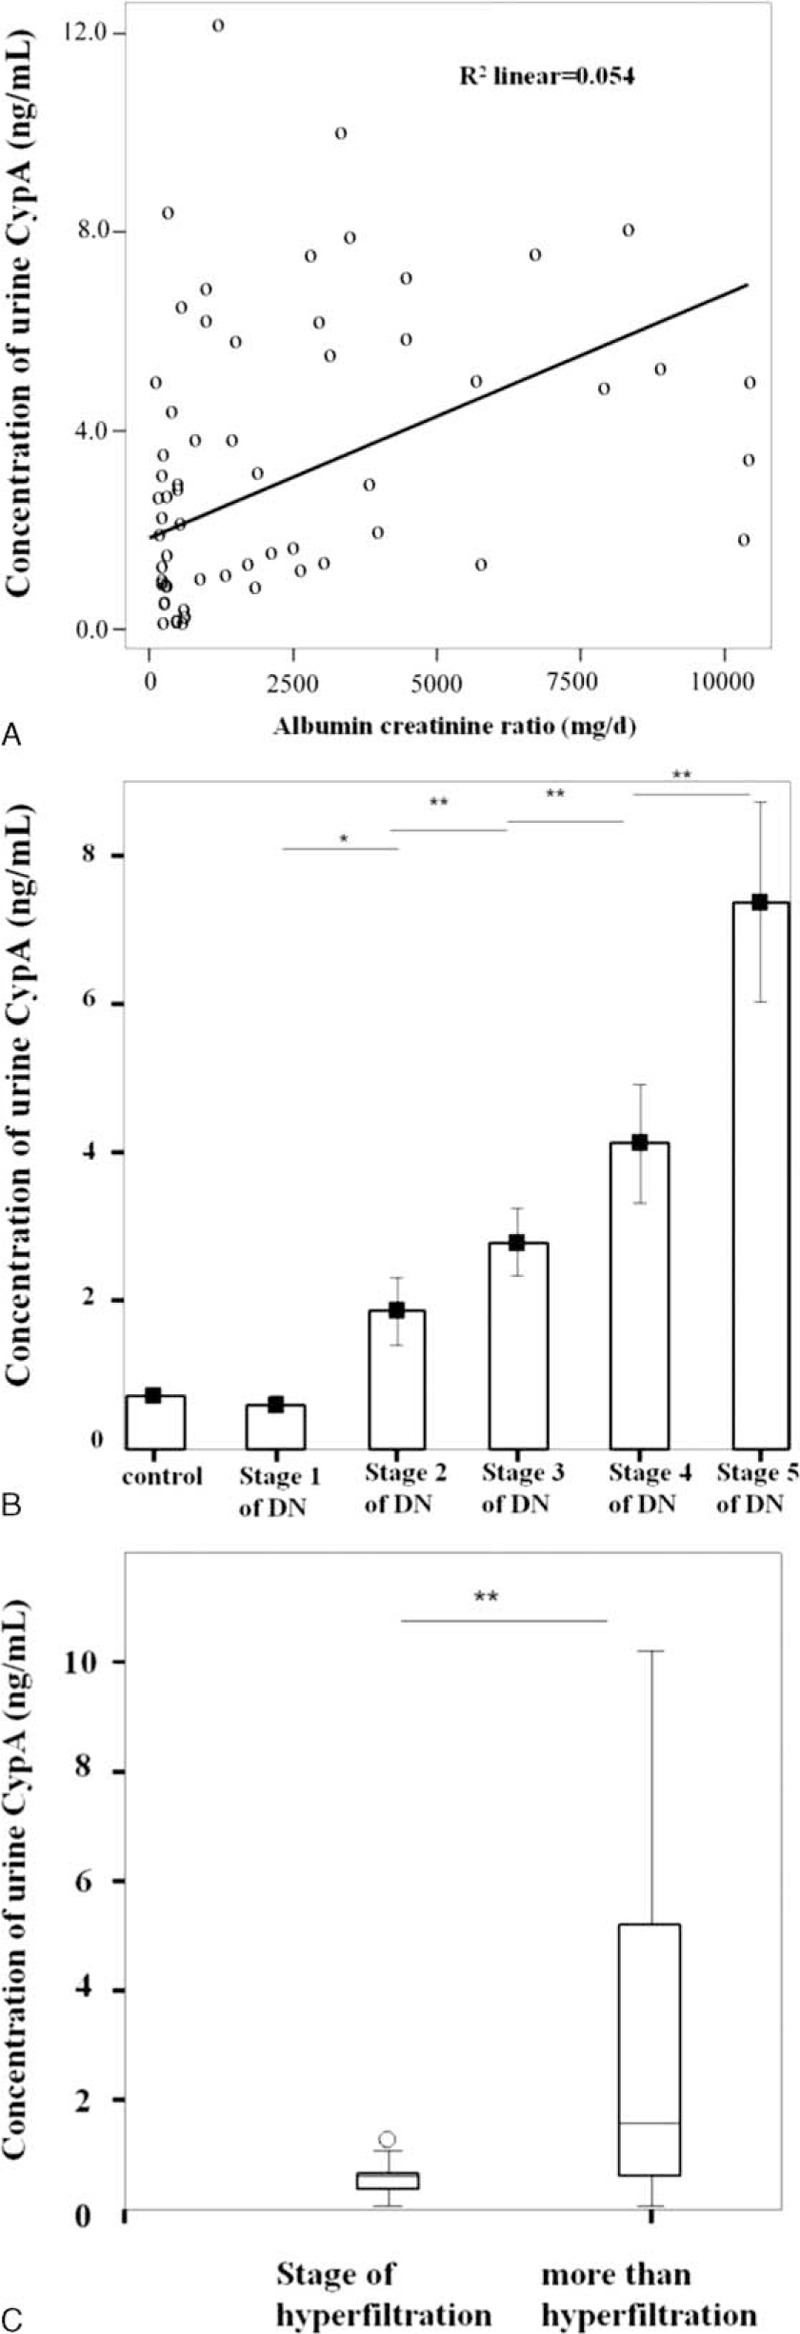
FIGURE 2.

Concentrations of urinary CypA in different stages of DN. (A) Concentration of urinary CypA and ACR were plotted. When ACR increased by 1 mg/g, the concentration of urinary CypA increased 0.030 ng/mL (CypA = 2.461 + ACR∗0.001). R2 linear was 0.054. (B) No difference in concentration of urinary CypA was found between stage 1 DN and healthy control groups (P = 0.117). However, there were statistically significant differences between stages 1 and 2, stages 2 and 3, stages 3 and 4, and stages 4 and 5 DN (P = 0.012, 0.003, <0.001, and 0.005, respectively). (C) The differences between stage 1 DN and stages 2 to 5 DN were statistically significant (P = 0.006). ∗P < 0.05, ∗∗P < 0.01, ∗∗∗P < 0.001. ACR = albumin creatinine ratio, CypA = cyclophilin A, DN = diabetic nephropathy.
