FIGURE 4.

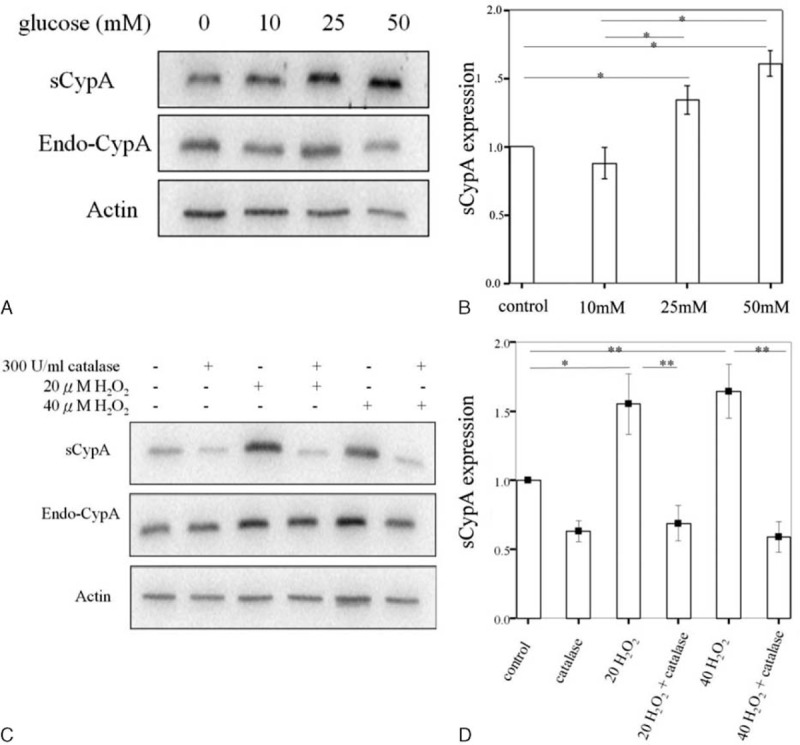
Western blotting of sCypA expression in MES-13 cells treated with different concentrations of glucose and H2O2. (A) Glucose increased the expression of sCypA, which was dose-dependent (10, 25, and 50 mM). (B) Statistical analysis showed that the increased expression of sCypA was found at 25 mM versus control (P = 0.037), and 50 mM versus control (P = 0.037). Increased expression of sCypA was observed at 50 versus 10 mM (P = 0.018). (C) The expression of sCypA was increased in cells with 20 or 40 μM H2O2 treatments. They could both be counteracted by 300 U/mL catalase. (D) Quantitative assessment showed that 20 μM H2O2 increased the expression of sCypA (P < 0.05) (n = 6), which could be reversed by 300 U/mL catalase (P < 0.01) (n = 6). The sCypA expression was also stimulated by 40 μM H2O2 (P < 0.01) (n = 6), which could be counteracted by 300 U/mL catalase (P < 0.01) (n = 6). (n = 4) ∗P < 0.05, ∗∗P < 0.01. Endo-CypA = endogenous cyclophilin A, MES-13 = mesangial, sCypA = secreted cyclophilin A.
