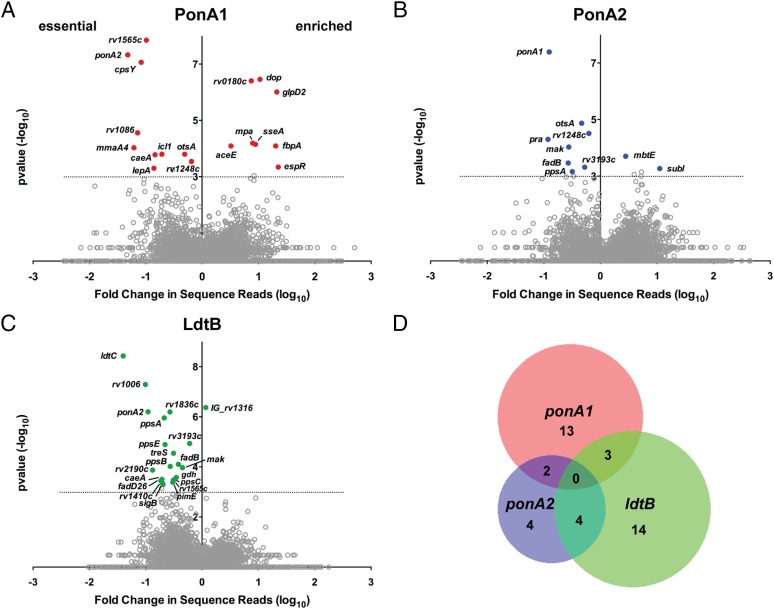
Fig. 2.
ponA1, ponA2, and ldtB have largely distinct genetic interactions. Loci whose sequence reads were significantly different between wild-type and mutant cells [(A) ΔponA1, red circles; (B) ΔponA2, blue circles; (C) ΔldtB, green circles] with a P value <0.001 (represented by the dotted line) by the Mann–Whitney u test are plotted according to their P value and fold change in sequence reads from wild type (calculated from the geometric mean). Gray circles, nonsignificant loci. Gray circles above the dotted line are loci that are <90% significant in the simulations (SI Materials and Methods). (D) Venn diagram representation of the distinct interaction networks of ponA1, ponA2, and ldtB.

