
Fig. 1.
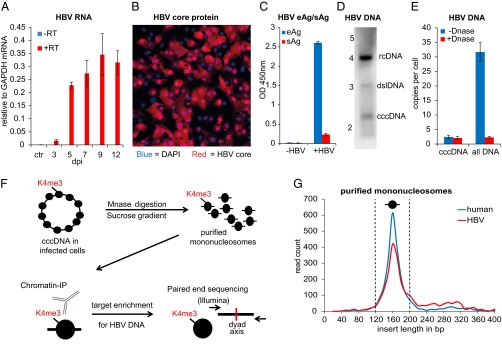
De novo infection of HepG2-NTCP1 cells and preparation of cccDNA chromatin. (A) Quantitative RT-PCR (qRT-PCR) of HBV RNA collected 3 dpi to 12 dpi (with or without reverse transcription in blue and red, respectively) normalized to GAPDH mRNA (n = 2, ±SD). Uninfected HepG2-NTCP1 cells served as the control (ctr). (B) HBV core protein immunostaining of HepG2-NTCP1 cells at 7 dpi showing an infection rate of ∼73%. HBV core (HBc) protein is shown in red, cell nuclei stained with DAPI in blue. (C) eAg and sAg levels in supernatant of cells infected with or without HBV at 7 dpi measured by ELISA. (D) Southern blot analysis of HBV DNA in HIRT extract at 7 dpi. Migration of a DNA standard is indicated in kilobases on the left; position of relaxed circular (rcDNA), double-stranded linear (dslDNA) and cccDNA is indicated on the right. (E) qPCR of HBV DNA at 7 dpi with primers specific for cccDNA or total HBV DNA. Shown is the average copy number of HBV molecules per cell. Samples were treated with or without Plasmid-Safe DNase as indicated (n = 2 ±SD). (F) Schematic of cccDNA ChIP-Seq assay. Nucleosomes in cccDNA (and cellular chromatin) are marked with PTMs, e.g., H3K4me3, at specific positions. HBV-infected cells were digested with micrococcal nuclease and resulting mononucleosomes purified by sucrose gradient centrifugation. Nucleosomes with PTM were enriched with specific antibodies by ChIP and the associated DNA enriched for HBV-specific sequences. Paired-end sequencing was used to determine the insert size and middle point (nucleosome dyad axis) of each DNA fragment. (G) Length distribution of cellular and HBV DNA from isolated mononucleosomes. The insert size distribution of 2,400 paired-end reads aligning to either human (blue) or HBV (red) genome is shown. The vertical dashed lines indicate the insert size window that was used for computational analysis.