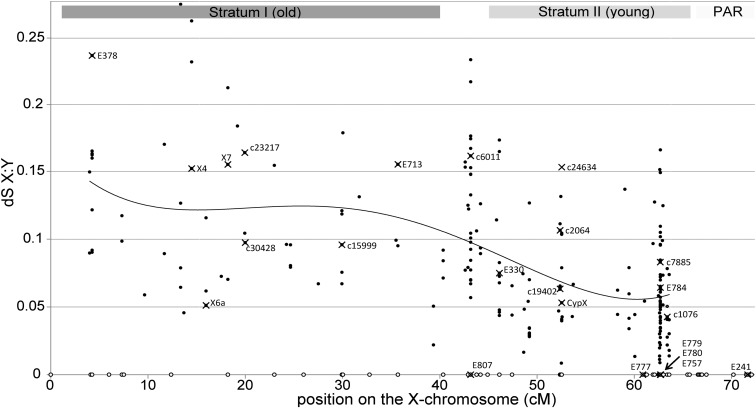
Fig. 1.
Synonymous divergence between homologous X- and Y-linked genes plotted against position in the genetic map of the X chromosome. The PAR extends to the right of this plot, from 64 to 114 cM. The curve is a fourth-order polynomial fitted to the data. Mapped X-linked genes with no homologous reconstructed Y-linked copy are shown as open circles on the horizontal axis. Data points corresponding to genes that were mapped in previous studies (22, 38) are represented by crossed circles and labeled with gene names used previously. Gray rectangles at the top signify approximate locations of the evolutionary strata, as defined in ref. 38.

