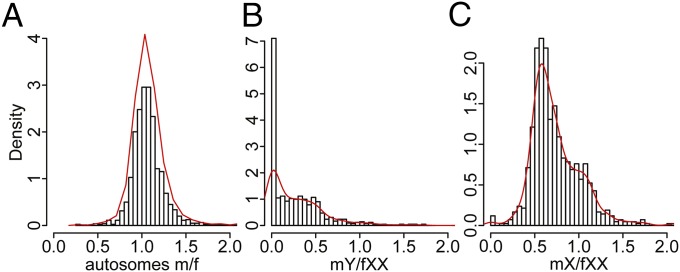
Fig. 2.
Distribution of relative transcript abundance in S. latifolia males and females. (A) Relative male (m) versus female (f) expression for autosomal genes with known positions in the genetic map (1,657 genes). (B) Expression of Y-linked genes in males normalized by expression of X-linked gametologs in females (866 genes). (C) Expression of X-linked genes in males relative to females (848 genes). The curve shows the kernel-smoothed density function.

