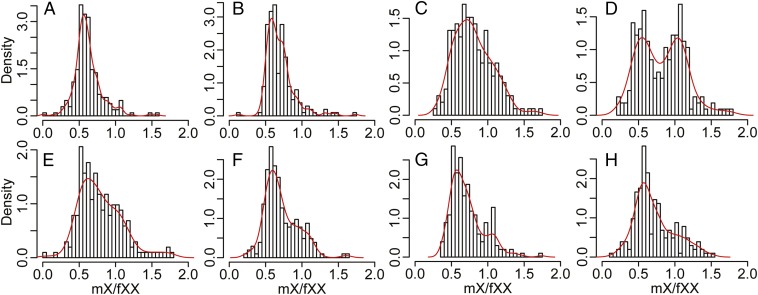
Fig. 3.
Probability density histograms of relative transcript abundance for X-linked genes in S. latifolia males and females (mX/fXX). The data are partitioned according to transcript abundance for Y-linked genes in S. latifolia males (mY) compared with S. vulgaris (Sv) (A–D) and quartiles for synonymous divergence (dS) between homologous X- and Y-linked genes (E–H). (A) Genes with mY/Sv ≥ 0.667 (176 genes); (B) 0.667 > mY/Sv ≥ 0.256 (201 genes); (C): 0.256 > mY/Sv ≥ 0.0001 (250 genes); and (D): mY = 0 (233 genes). (E) Includes the genes with dS ≤ 0.038 (225 genes); (F) 0.038 < dS ≤ 0.0602 (218 genes); (G) 0.0602 < dS ≤ 0.0975 (212 genes); and (H) dS > 0.0975 (216 genes). The curve shows the kernel-smoothed density function.

