Fig. 3.
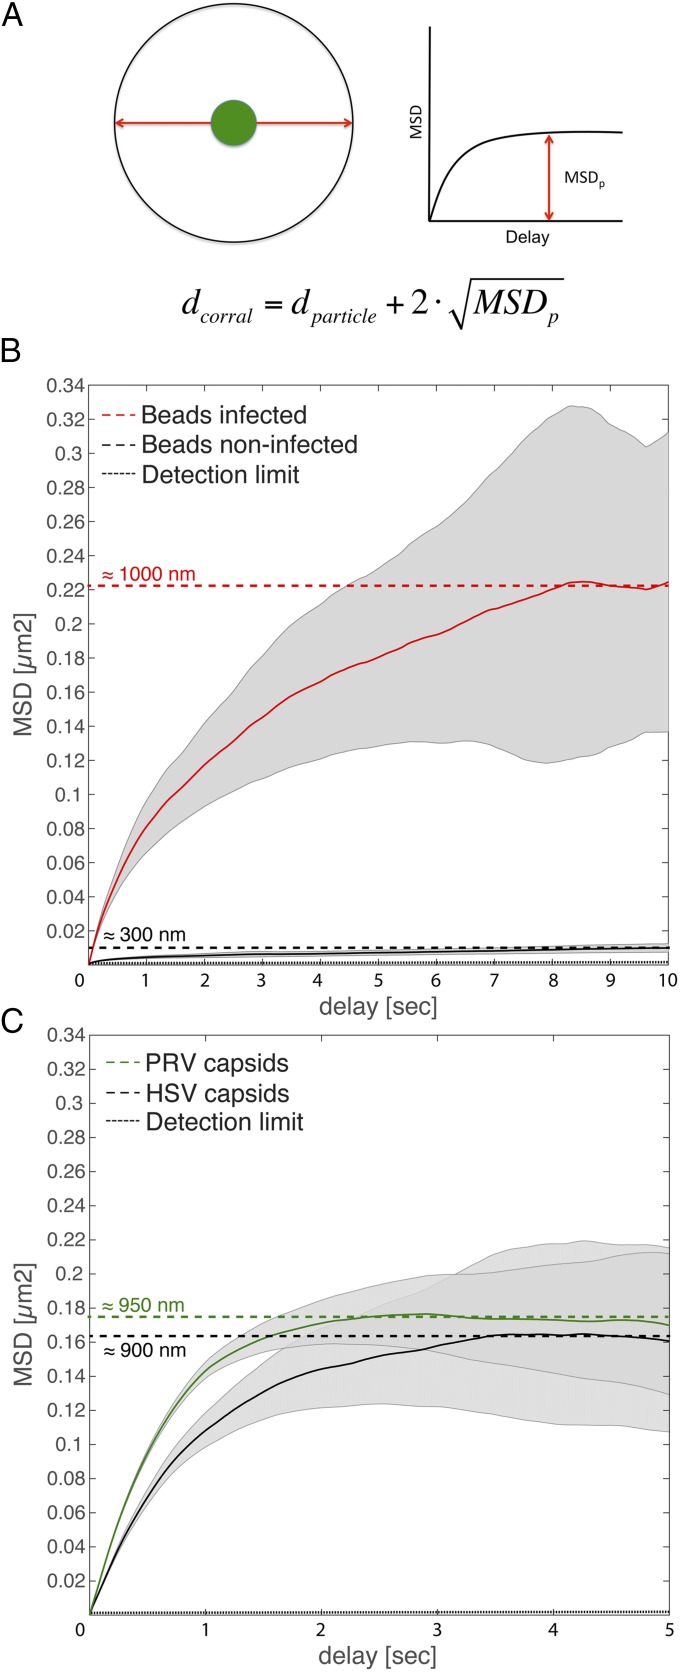
Herpesvirus infection leads to increased nuclear corral size. PtK2 cells were infected with mEFGP-VP26–tagged PRV or EGFP-VP26–tagged HSV-1 at an MOI of 100 or microinjected with passivated, 100-nm latex beads and infected the next day. At 4 h or 5 h after infection, respectively, cells were stained with 0.5 µg/mL Hoechst 33342 and imaged with ring-sheet microscopy at a frame rate of 36 frames per second for 28 s (PRV and HSV) or imaged with static oblique microscopy at 42 frames per second for 24 s (noninfected beads) or at 28 frames per second for 36 s. (A) Estimation of corral sizes. A particle (green) is trapped in an idealized spherical corral. Its maximum mean displacement is the radius of the sphere minus the radius of the particle (red arrow). Its MSD curve will therefore saturate. The mean corral diameter can be estimated by doubling the square root of MSDp and adding the particle diameter. (B) Average MSD curves as well as their SE (gray) of bead tracks from noninfected cells (black line) and from PRV-infected cells (red line) were plotted in linear space. Their saturation points were determined (dotted lines), and approximate corral sizes are indicated. (C) The same MSD dataset as used in Fig. 1 (green, PRV; black, HSV-1) was plotted in linear space, and their saturation point estimated. The dashed line indicates the detection limit of 40 nm2.

