
Fig. 4.
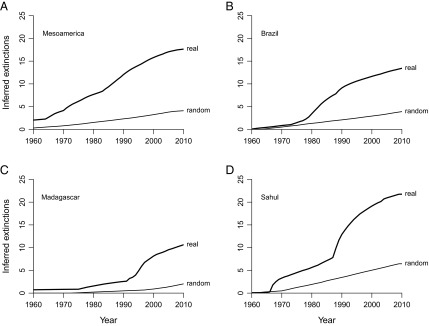
Simulated extinction proportions recovered by Bayesian analysis in the presence and absence of extinction. Data are for (A) Mesoamerica, (B) Brazil, (C) Madagascar, and (D) the Sahul region. Upper lines (“real”) show actual values. Lower lines (“random”) show data produced by randomizing collection dates, which obliterates any signal of true extinction.