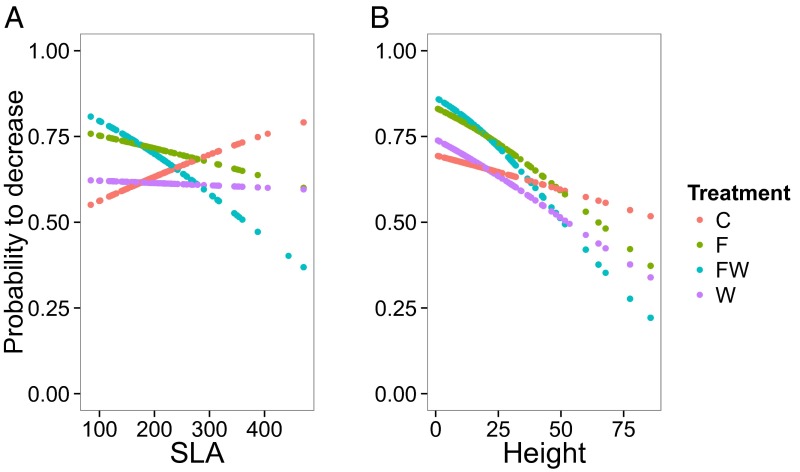
Fig. 3.
Probability of individual species to decrease from 2010 to 2014 as a function of species specific (A) SLA (mm2), and (B) height (cm), under different combinations of watering and fertilization across all habitats. The values represent fitted (predicted) values per individual trait values from GLMM where three-way interactions among watering, fertilization, and traits (SLA and height in separate models) were used as explanatory variables, and likelihood of each species decreasing in each plot was used as response variable (each species was assigned 1 if it decreased and 0 if it did not, and this 1–0 variable was the response variable). In the models, species were nested within plots. Only fitted values but no data points are shown (those would be 1 s and 0 s). For clarity of the figures, we removed two extreme observations from SLA and one extreme observation from height data; however, parameter significances remained similar regardless of whether or not the extreme values were included in the models. C, control; F, fertilization; W, watering; FW, fertilization and watering.

