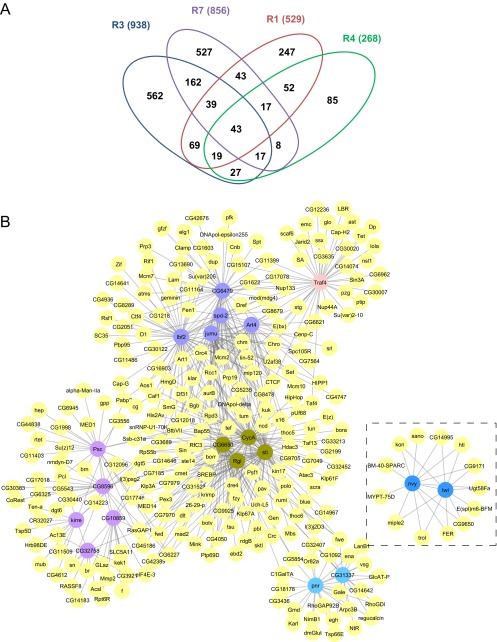
Fig. S6.
Coexpression network analysis using more stringent criteria also identifies a specific cluster associated with the transcription factor twi. (A) A Venn diagram showing in parentheses the number of genes up-regulated at late, compared with early, passages in the R1, R3, R4, and R7 cell lines when using Padj < 0.15 (SI Methods). (B)The network is focused on commonly up-regulated genes (43 seeds) in the R1, R3, R4, and R7 cell lines. Genes in all datasets with expression profiles highly correlated (correlation coefficient ≥0.8) to the seeds are in yellow. Seeds with similar expression profiles are found in six clusters (Dataset S7). The twi cluster is highlighted in the dashed frame.

