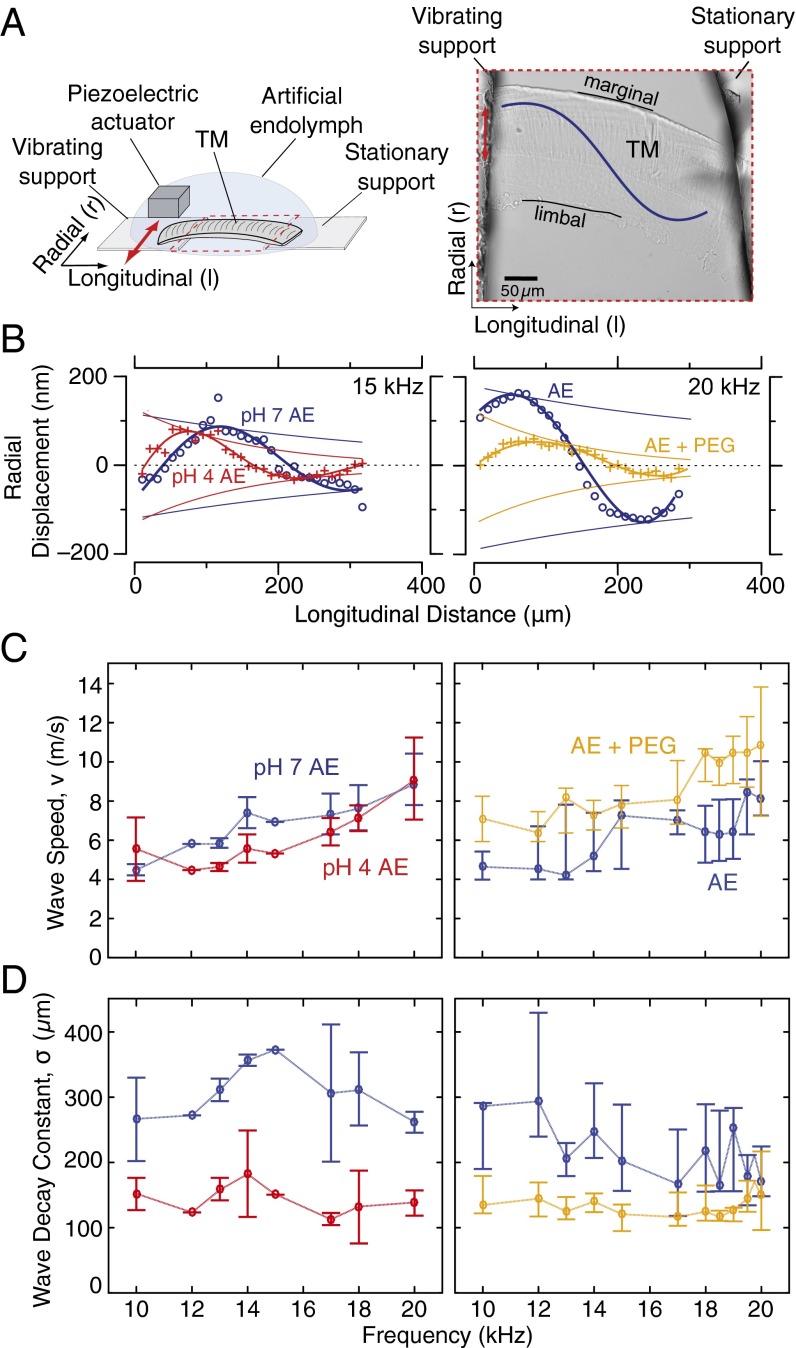
Fig. 2.
TM wave measurements in response to chemical manipulations. (A, Left) Schematic drawing of TM wave chamber showing the position of the TM relative to the piezoelectric actuator, optics, and support structures. (A, Right) Optical image (20× magnification) of a basal TM segment attached between two supports. (B, Left) TM wave snapshot in AE at pH 7.3 (blue) and following equilibration in an AE bath at pH 4 (red). (B, Right) TM wave snapshot in AE (blue) and after increasing bath viscosity with addition of 15 mM 8-kDa PEG (orange). (C, Left) TM wave speed (median and interquartile range) in AE at physiological pH and following reduction to pH 4 (n = 4 preparations). (C, Right) TM wave speed in AE and in a high-viscosity bath equilibrated with PEG (n = 7 preparations). Wave speeds dropped slightly at most measured frequencies in response to low pH, whereas high viscosity caused an increase in wave speed across all frequencies. (D) TM wave decay constants (median and interquartile range) in AE at physiological pH and following reduction to pH 4. TM wave decay constants in AE and in a high-viscosity bath equilibrated with PEG. In AE with physiological viscosity, TM wave decay constants ranged from 160 to 450 μm at 10–20 kHz, whereas increasing bath viscosity caused a decrease in the wave decay constant (medians below 150 μm) at every measured frequency.

