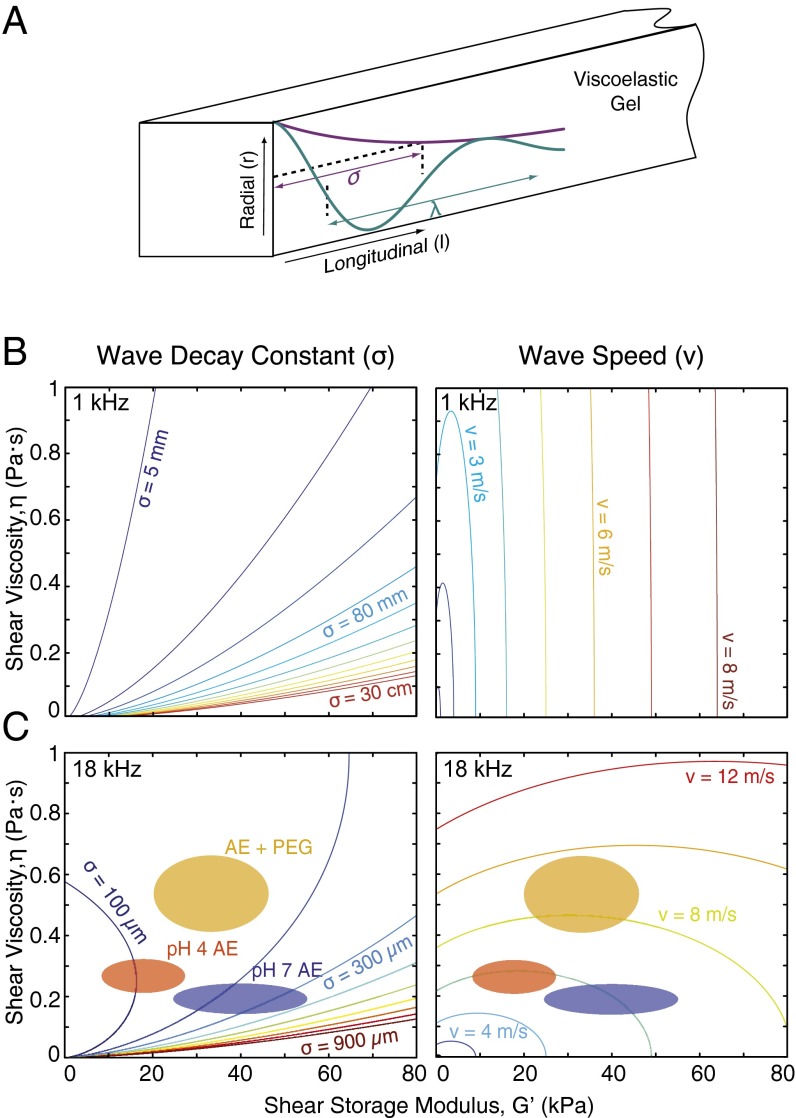
Fig. 4.
Viscoelastic gel model predictions of TM material properties and wave properties. (A) Schematic drawing of wave propagation through a viscoelastic gel. Contours denote the range of values for wave decay constants and wave speeds at 1 kHz (B) and 18 kHz (C). Colored ellipses pasted on the decay constant and speed contours indicate mean and SD of and η calculated from 17- to 19-kHz wave properties at (i) physiological bath pH and viscosity (blue), (ii) decreased bath pH (red), and (iii) increased bath viscosity with 15 mM 8-kDa PEG (orange).

