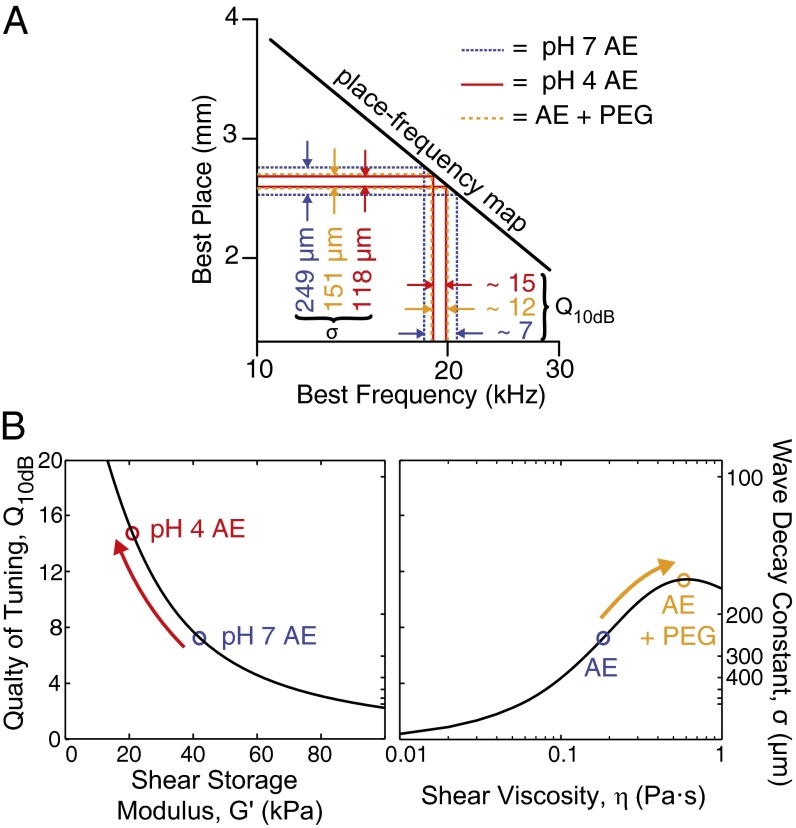
Fig. 5.
Relationship between TM material properties and tuning. (A) TM wave decay constants, in conjunction with the slope of a place-frequency map, are used to calculate quality of tuning. The solid black line represents the relation between best place and best frequency (54). Horizontal lines and single-sided arrows denote the spatial extent of TM waves (i.e., wave decay constants) for TMs at physiological conditions (mean of 17–19 kHz, blue, 249 μm), with increased viscosity (orange, 146 μm), and reduced pH (red, 118 μm). Vertical dashed lines and single-sided arrows denote the frequency bandwidth around the best frequency. The ratio of frequency bandwidth and best frequency yields in physiological conditions (7), with increased bath viscosity (12), and with reduced bath pH (15). (B) Tuning quality factor () estimates determined from the viscoelastic model as a function of shear storage modulus and shear viscosity at 18 kHz. Open circles indicate predicted from experimental conditions (mean of 17–19 kHz). (Right) estimates increase with increasing shear viscosity, η, when the shear storage modulus is fixed (40 kPa). (Left) In contrast, estimates decrease with increasing shear storage modulus, , when shear viscosity is fixed (0.20 Pa⋅s).

