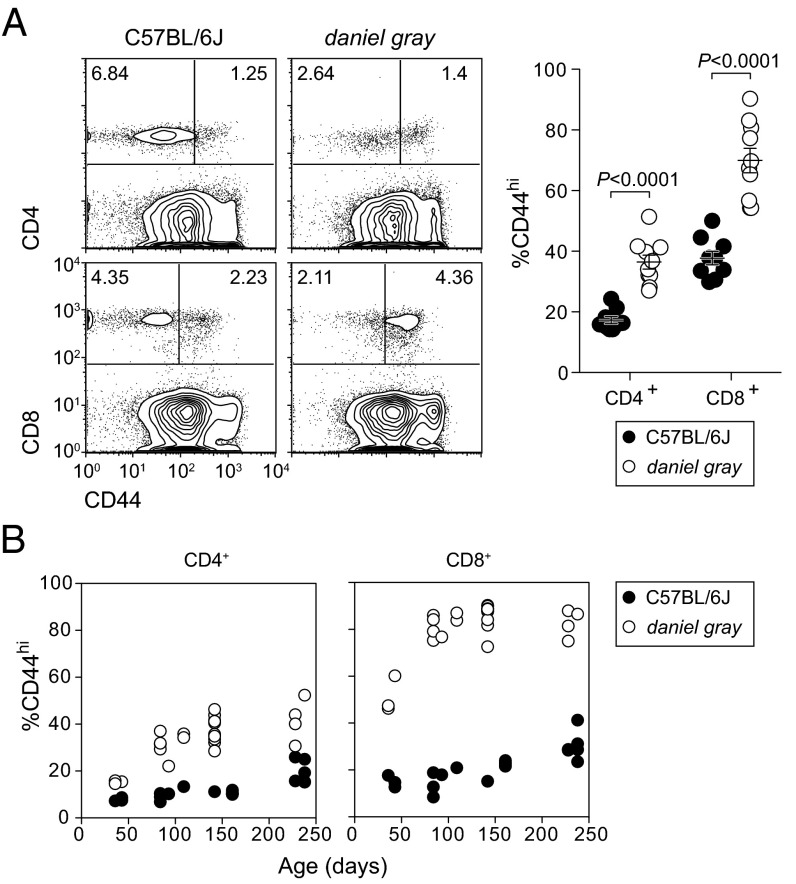
Fig. 1.
An inherited phenotype associated with expansion of CD44hi T cells. (A) Flow cytometry plots of CD44 expression on CD4+ and CD8+ blood lymphocytes (Left) and frequencies of CD44hi cells in either population (Right). P values were determined by unpaired t test. (B) Frequencies of CD44hi cells among CD4+ and CD8+ populations as a function of age. Each symbol represents an individual mouse. Data are representative of 1 (B) or more than 10 (A) experiments (error bars represent SEM).

