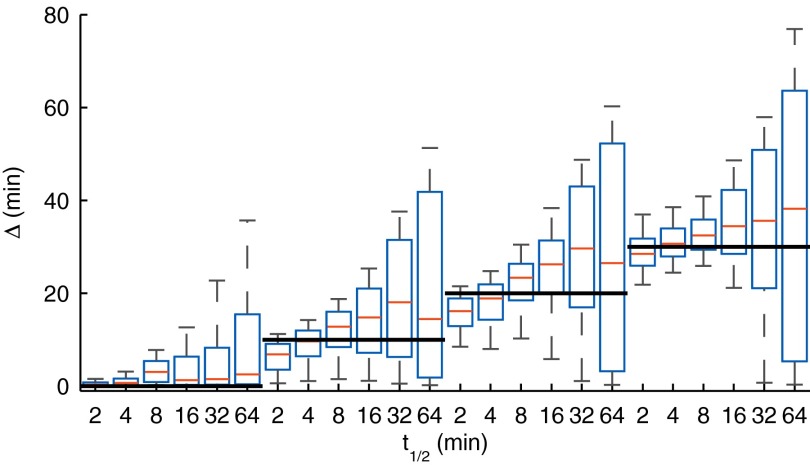
Fig. 3.
Boxplots of parameter posterior distributions illustrating parameter estimation performance on synthetic data for the delay parameter . The bolded black lines indicate the ground truth used in data generation. The box extends from 25th to 75th percentile of the posterior distribution, whereas the whiskers extend from ninth to 91st percentile. The results show that delay estimates are accurate and reliable, with the true value always in the high posterior density region.

