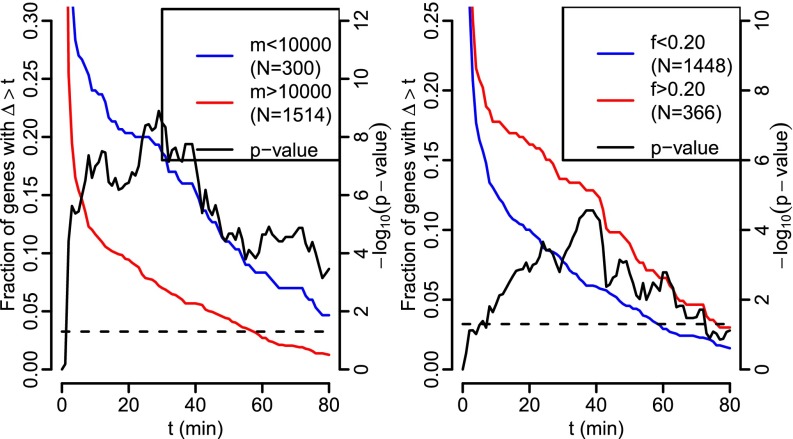
Fig. 5.
Tail probabilities for delays. (Left) Genes whose longest pre-mRNA transcript is short (m is the length from transcription start to end). (Right) Genes with relatively long final introns (f is the ratio of the length of the final intron of the longest annotated transcript of the gene divided by the length of that transcript pre-mRNA). The fraction of genes with long delays is shown by the red and blue lines (left vertical axis). In both subplots, the black curve denotes the P values of Fisher’s exact test for equality of fractions depicted by the red and blue curves conducted separately at each point (right vertical axis), with the dashed line denoting P < 0.05 significance threshold. Similar plots for other values of m and f, as well as different gene filter setups, are given in SI Appendix, Figs. S4 and S5.

