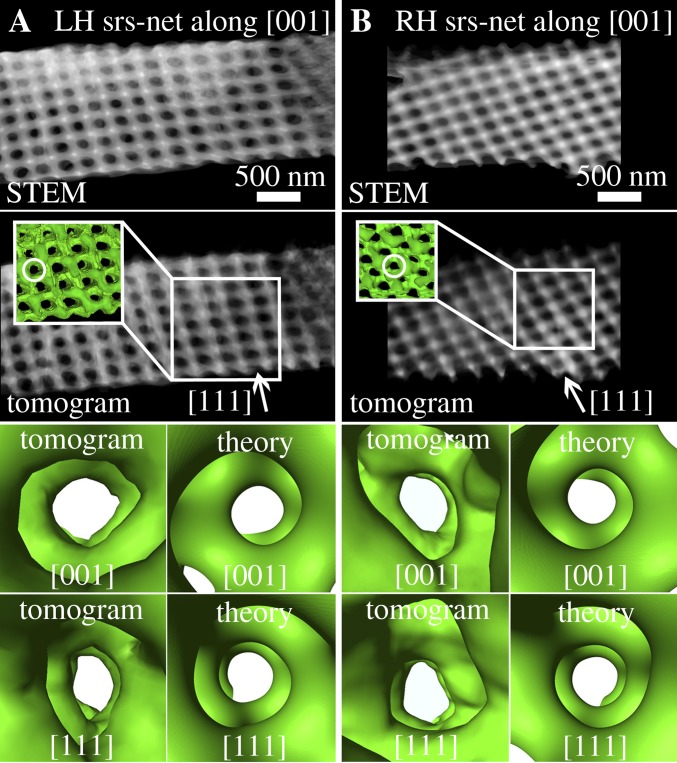
Fig. 3.
Exemplary ET datasets of two crystallites with opposite chirality. (A) LH srs-net and (B) RH srs-net. In row 1, STEM images from the respective tilt series (horizontal tilt axis) of the investigated crystallites are shown with direct view along the fourfold [001] zone axes. Row 2 shows representations of the tomograms (volume rendering; parallel view and visualization adapted to match the respective STEM projections in row 1) of the respective crystals; Insets show surface renderings of smaller parts of the crystallites. In rows 3 and 4, perspective views along the pore channels of the tomograms and the respective views in the theoretical gyroid structure are shown (compare with Fig. 1D). The directions of the channels within the respective crystallites are indicated by circles ([001]) and arrows ([111]). Fig. S2 shows the respective views in the tomograms along the [111] zone axes. Movies S1 and S2 show animations of the tomograms from A and B.

