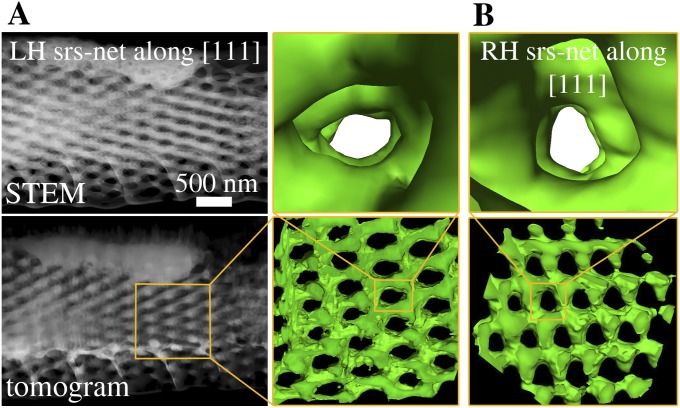
Fig. S2.
ET datasets of two crystallites (different scales) with opposite chirality. (A) The crystal domain in Fig. 3A oriented nearly along its threefold symmetry axis [111]: (Upper Left) STEM image from the respective tilt series (tilt angle of +60°), (Lower Left) representation of the tomographic reconstruction (volume rendering; parallel view and visualization adapted to match the respective STEM projection), (Lower Right) surface rendering (parallel view; viewing direction indicated with an arrow in Fig. 3A) of a smaller part of the crystallite, and (Upper Right) magnified perspective view of the surface rendering. (B) The crystal domain in Fig. 3B oriented along its threefold symmetry axis [111]: (Lower) surface rendering (parallel view; viewing direction indicated with an arrow in Fig. 3B) of a smaller part of the crystallite and (Upper) magnified perspective view of the surface rendering.

