
Fig. 2.
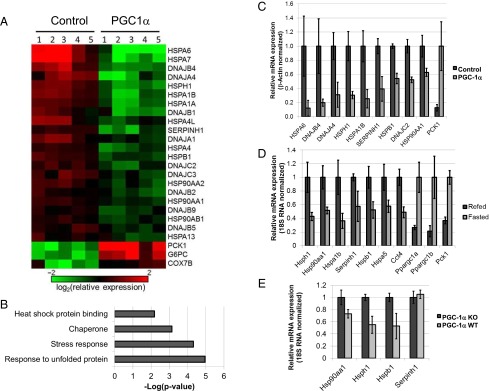
HSR genes are repressed by PGC-1α in primary human hepatocytes and by fasting in mouse liver. (A) Heat map representing mRNA expression of selected genes affected by adenoviral expression of PGC-1α in human primary hepatocytes (PGC-1α) relative to control cells (Control) as determined by microarray analysis. Each column represents one sample derived from a single human donor. (B) HSR-related terms in term enrichment analysis of genes repressed 1.5-fold or more by PGC-1α expression in human primary hepatocytes. (C) RT-PCR validation of mRNA expression of several genes identified as repressed by PGC-1α in primary human hepatocytes in our microarray analysis. Values represent averages of data from five donors; P < 0.01. (D) RT-PCR analysis of mRNA expression of several HSR genes in mouse liver during fasting or after refeeding. Values represent averages of data from eight or nine mice; P < 0.05. (E) RT-PCR analysis of mRNA expression of several HSR genes in PGC-1α KO or WT mouse livers during fasting. Values represent averages of data from seven to nine mice; P < 0.05.