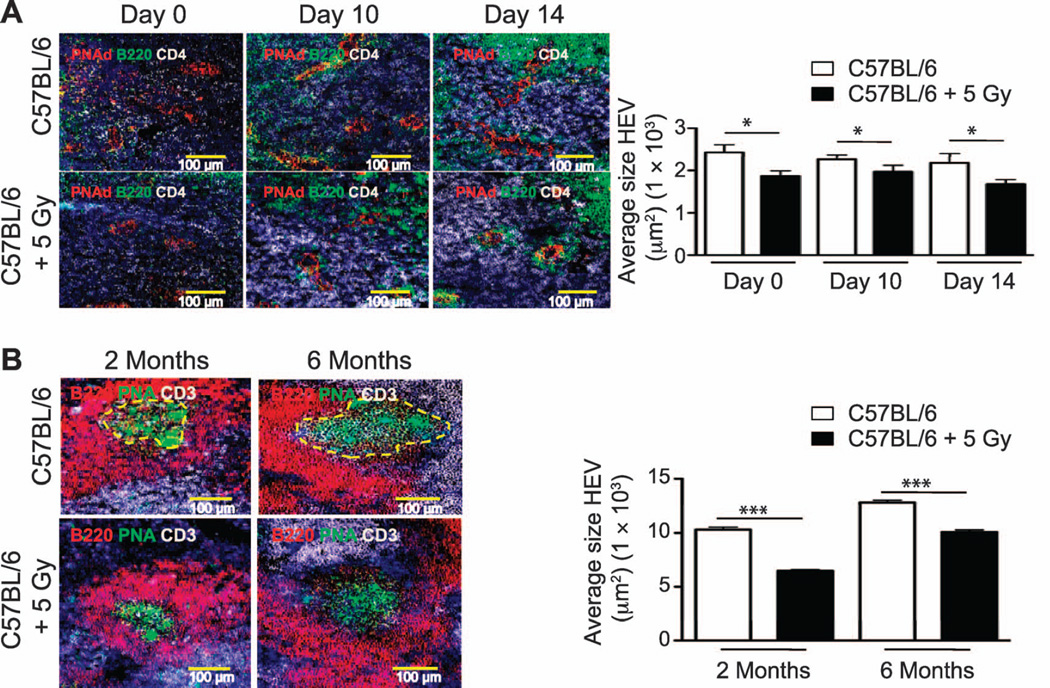
FIG. 12.
Morphometric analyses of structural and cellular changes in MLN and spleens were performed at 2 and 6 months postirradiation. Panel A: Representative 200× pictures of PNAd+ HEV (red vessels), B220+ B cells (green cells) and CD4+ T cells (white cells) in MLN from control and neonatally irradiated 2-month-old mice before infection (day 0) or after influenza challenge (day 10 and 14 after infection). Panel B: Spleen frozen sections from influenza-infected, sham-irradiated and irradiated C57BL/6 mice (2 and 6 months of age) were stained with antibodies against B220 (red), CD3 (white) and peanut agluttinin (green) to detect PNA+ germinal centers. PNA+ GC were measured using an automated tool from the Zeiss Axioplan software and the average size of GC was calculated. Representative 200× pictures of peanut agglutinin-binding GC are outlined with dashed yellow lines (day 14 after infection). HEV dimensions and GC size were determined using an automated tool from the Zeiss AxioVision software. n = 5/group. Results represent mean ± SEM. *P < 0.05; ***P < 0.005.

