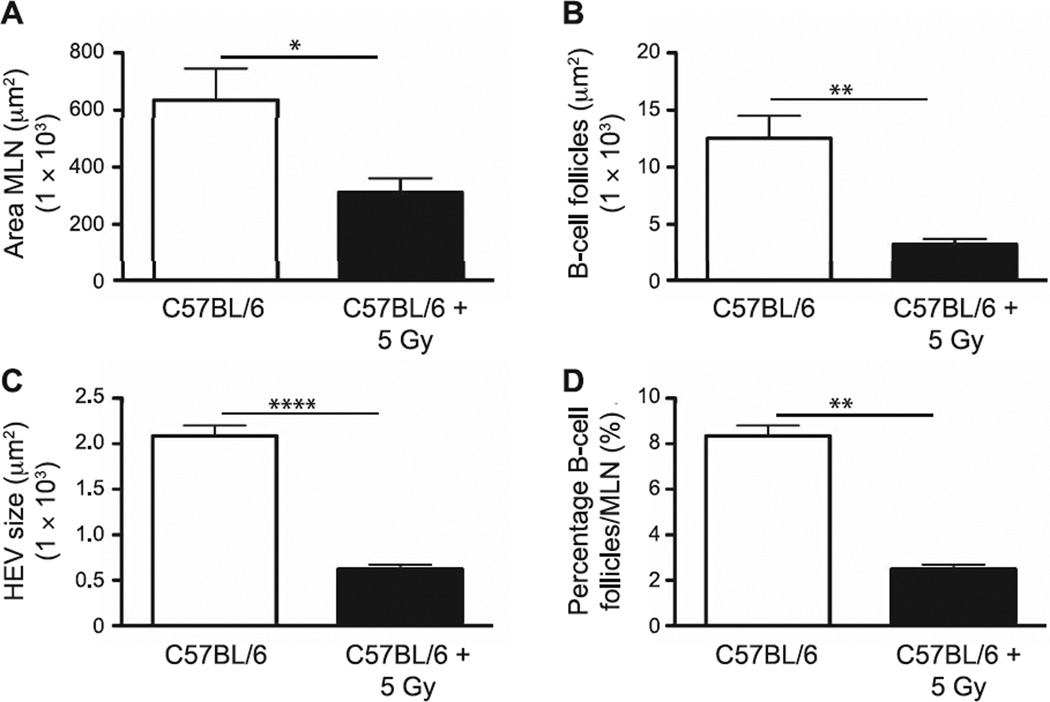
FIG. 6.
Morphometric analyses of structural and cellular changes in MLN performed at 7 days postirradiation were determined using an automated tool from Zeiss AxioVision software. Panel A: Dimensions of MLN; panel B: average size of B-cell follicles; panel C: HEV; and panel D: percentage covered by B-cell follicles/MLN section. n = 5 mice per group. Graphs represent mean ± SEM. *P < 0.05; **P < 0.005; ****P < 0.0001.

