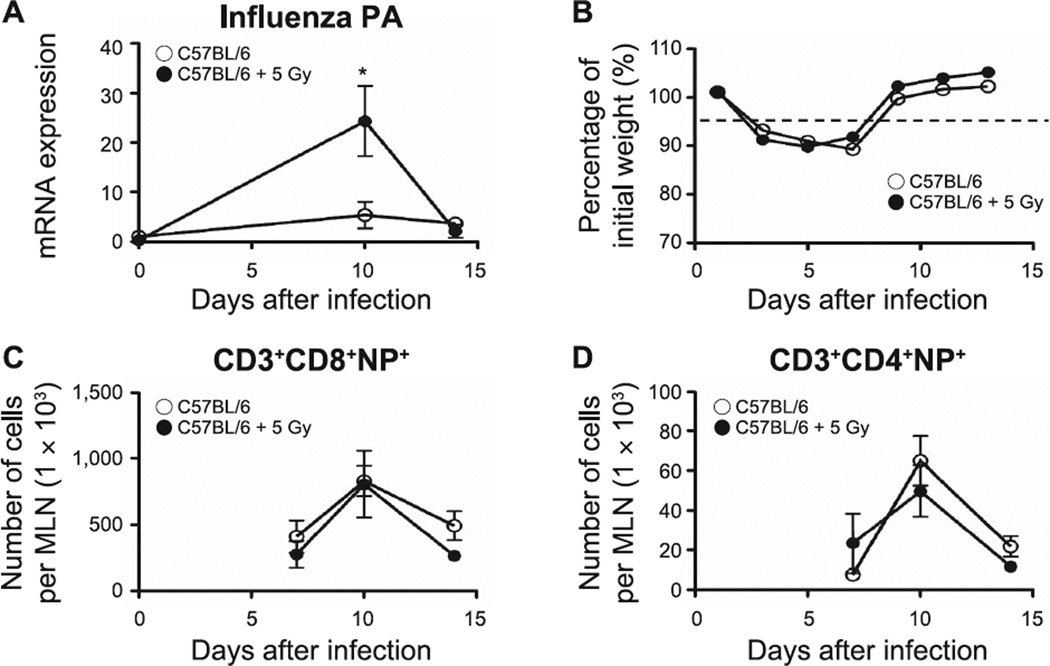
FIG. 9.
The effect of influenza infection in lungs of 2-month-old mice. Panel A: Changes in influenza PA expression determined by quantitative PCR. Panel B: Changes in body weight monitored every other day during influenza infection. Panels C and D: Kinetics of accumulation of effector lymphocyte T cells [CD3+CD8+NP+ T cells (panel C) and CD3+CD4+NP+ T cells (panel D)], assessed in lungs of sham-irradiated and neonatally irradiated mice by flow cytometry. n = 5/group. Graphs represent mean ± SEM. *P < 0.05.

