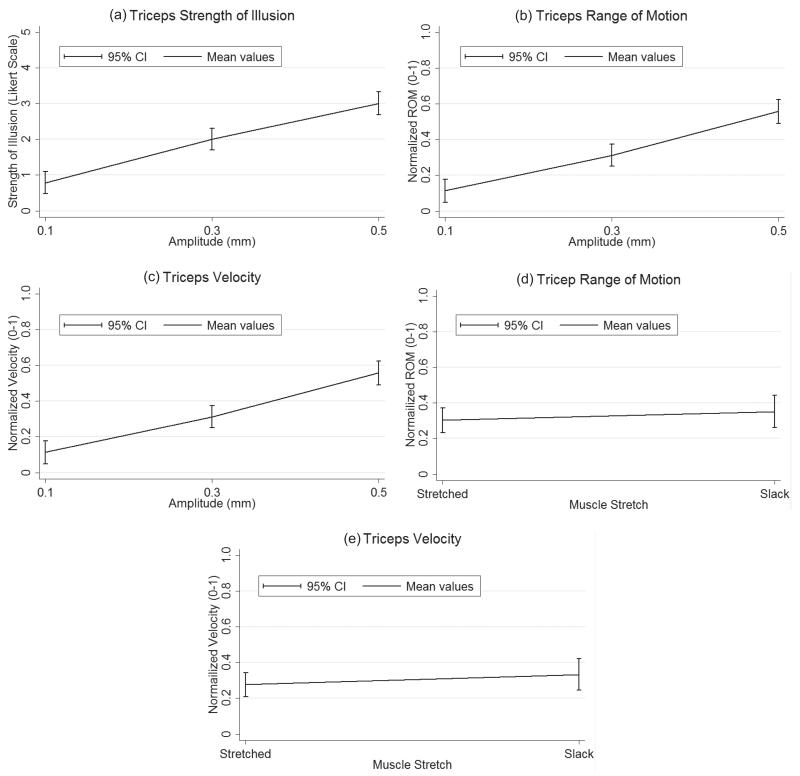
Fig. 4.
Tricep mean plots of significant. Mean values and 95% confidence intervals (CI) for each significant manipulated variable plotted at the levels specified in the vibration parameter testing section above. (a) Strength of illusion as a function of amplitude; (b) Normalized range of motion as a function of amplitude; c. Normalized velocity as a function of amplitude; (d) Normalized range of motion as a function of muscle stretch; (e) Normalized velocity as a function of muscle stretch.

