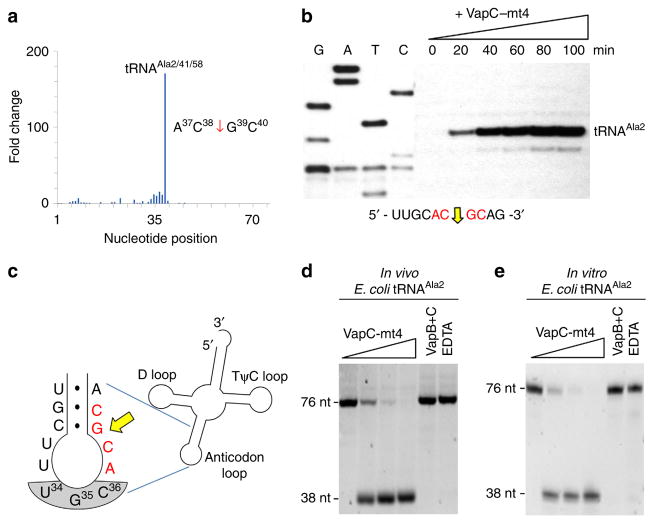
Figure 1. VapC-mt4 Cleaves tRNAAla2 in E. coli.
(a) Histogram representing the fold change in 5′-OH ends observed along the length of the tRNAAla2 upon comparison of cells with VapC-mt4 to those without VapC-mt4. The sequence surrounding the site of cleavage in tRNAAla2 is shown on the right; red arrow denotes position of cleavage. (b) Primer extension analysis with total E. coli RNA following the induction of VapC-mt4 for the times indicated. The RNA sequence (ACGC consensus in red) and positions of cleavage (yellow arrow) shown below the gel image. G, A, T and C lanes correspond to DNA-sequencing ladders using the same primer and a tRNAAla2 DNA template. The major primer extension band migrates between the G and Tresidues in the sequencing ladder instead of aligning exactly to the G residue. We attribute this to the repeatable aberrant migration of the sequencing ladder below this tRNA sequence. (c) Illustration of the RNA-seq cleavage site in the tRNAAla2 ASL, yellow arrow; ACGC consensus sequence in red, anticodon shaded in grey. (d,e) Cleavage assay with in vivo purified tRNAAla2 (d) or in vitro-synthesized tRNAAla2 (e) and increasing amounts of VapC-mt4 (ratios of toxin to RNA were 0:1, 1.25:1, 2.5:1 and 5:1). Control reactions on the right contained the highest concentration of VapC-mt4 preincubated with VapB antitoxin or EDTA before addition of the respective tRNAs. Reactions were incubated at 37 °C for 3 h. Sizes of full-length and cleaved tRNA products on the left. Complete gel images for (b,d,e) are shown in Supplementary Fig. 2.

