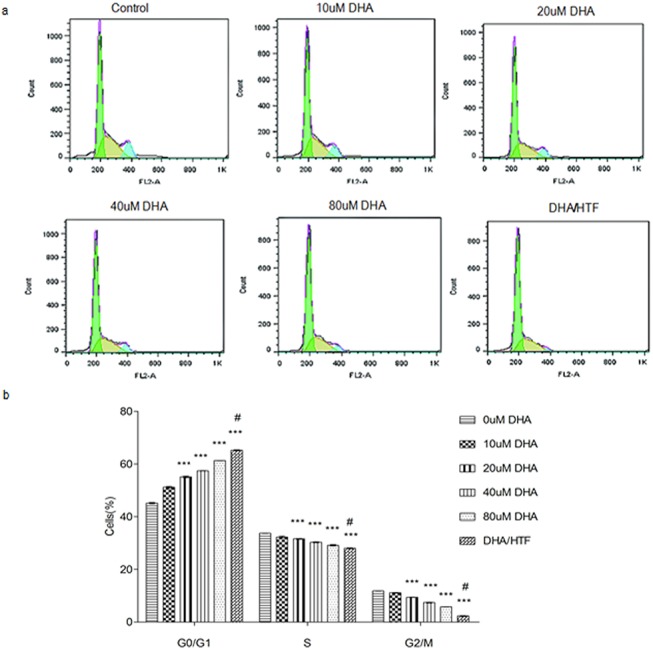
Fig 4. DHA and DHA/HTF impaired cell cycle progression in Jurkat cells.

Jurkat cells (1 × 10⁶/well) were exposed to DHA (0, 10, 20, 40, 80 μM) or DHA/HTF for 48 h, Cell cycle analysis of DHA- and DHA/HTF-treated cells was performed using flow cytometry. The ratio of cells in S and G2/M phases decreased while the numbers in G0/G1 phase increased in a dose-dependent manner (a, b). The results represented mean ± standard deviation. ***p<0.001, compared with the control group, # p<0.001, compared with DHA.
