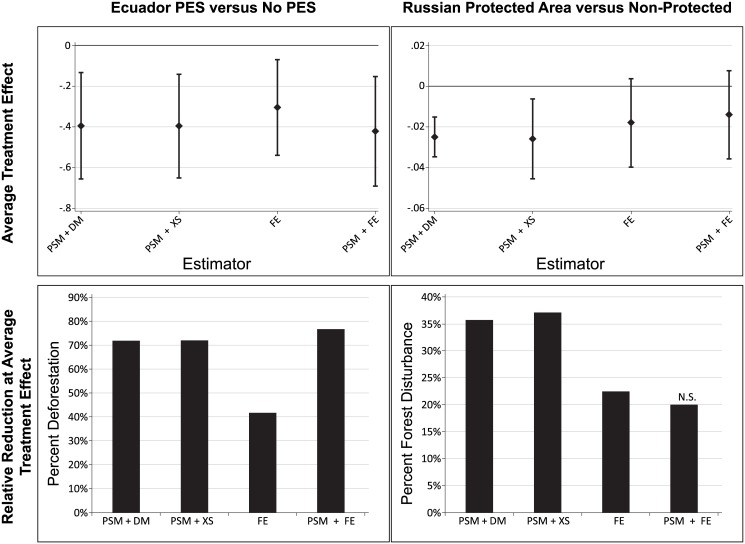
Fig 3. Treatment Effect Distribution and Relative Reduction in Deforestation (Ecuador) and Forest Disturbance (Russia).
Box plots show the average treatment effects and 95% confidence intervals (from Table 3). For estimators that use matching, the relative reduction in forest cover change is calculated as the estimated average treatment effect (Table 3) divided by the deforestation rate (Ecuador-PES) or the probability of forest cover change (Russia-Protected Areas) in the matched control observations after treatment. When matching is not used, the deforestation rate or probability of forest cover change in the full set of control observations is used. As an example, the relative effect for Ecuador-PES under propensity score matching and differences in means is calculated as 0.40/0.55 = 0.72. (The 0.55 is not reported in the tables but comes from calculating average deforestation in 2011–2013 from the matched control units.) For the same estimation strategy and Russia-Protected Areas, the relative reduction would be calculated as 0.03/0.07; again 0.07 is not reported in the tables. This gives the relative reduction in forest cover change that can be attributed on average to the conservation program. The four estimators are abbreviated as follows: PSM +DM: propensity score matching plus differences in means; PSM + XS: propensity score matching plus cross-sectional regression; FE: fixed effects panel regression; PSM + FE: propensity score matching plus fixed effects regression.

