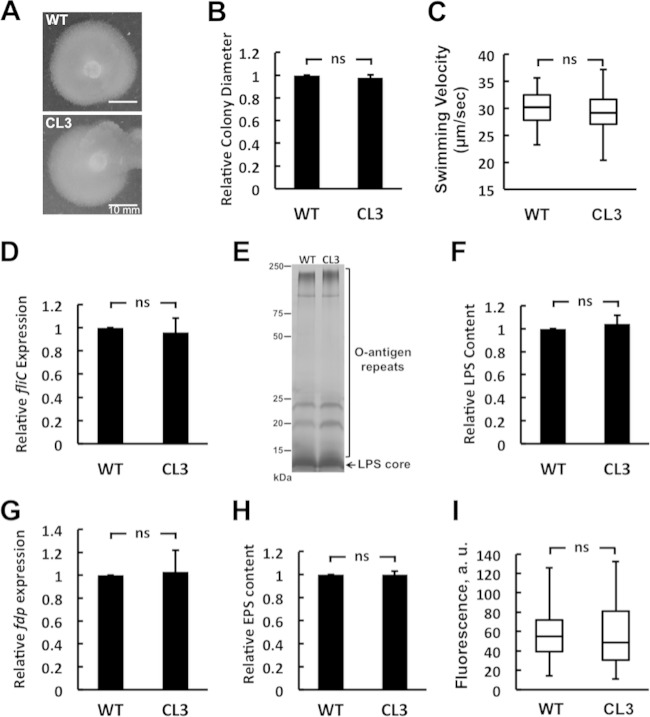
FIG 4.
CL deficiency of R. sphaeroides does not cause defects in swimming motility, LPS production, fdp gene expression, EPS production, and membrane permeability. (A) The motility of the R. sphaeroides wild-type (WT) and CL3 strains was assessed by using the same soft-agar swimming plate. (B) Diameters of swimming colonies of the R. sphaeroides WT and CL3 strains on soft-agar swimming plates. Shown are mean values ± standard deviations obtained from three independent experiments. (C) Box-and-whisker plots depicting the swimming velocities of individual R. sphaeroides WT and CL3 cells (n = 12). The extent of the box encompasses the interquartile range of the velocity, whiskers extend to maximum and minimum velocities, and the line within each box represents the median. (D) fliC gene expression in R. sphaeroides WT and CL3 cells assayed by qPCR. Shown are mean values ± standard deviations obtained from three independent experiments, each performed in triplicate. (E) LPSs from R. sphaeroides WT and CL3 cells separated on an SDS-polyacrylamide gel and visualized by silver staining. (F) The LPS content of cells was quantified by densitometry with ImageJ. Shown are mean values ± standard deviations obtained from three independent experiments. (G) fdp gene expression in R. sphaeroides WT and CL3 cells assayed by qPCR. Shown are mean values ± standard deviations obtained from three independent experiments, each performed in triplicate. (H) The distribution of EPS extracted from planktonic cultures of R. sphaeroides WT and CL3 cells, separated on an SDS-polyacrylamide gel, and quantified by densitometry with ImageJ. Shown are mean values ± standard deviations obtained from three independent experiments. (I) Box-and-whisker plots depicting the membrane permeability of the R. sphaeroides WT and CL3 strains measured by PI staining (n ≥ 100). The extent of the box encompasses the interquartile range of the PI fluorescence intensity, whiskers extend to maximum and minimum fluorescence intensities, and the line within each box represents the median. Differences between the parameters of the R. sphaeroides WT and CL3 strains were analyzed by Student's t test. The P value for all of the parameters measured was >0.5. ns, not significant.

