FIG 5.

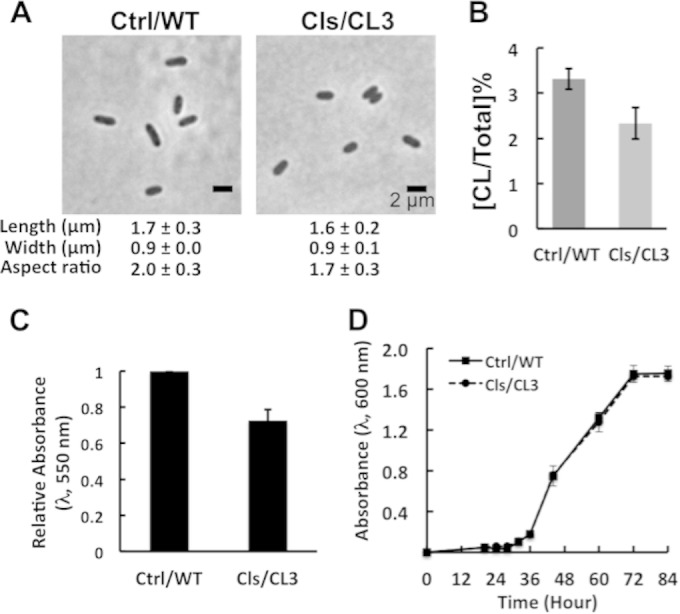
Complementation of the CL3 strain restores biofilm formation. (A) Images depicting the morphology of R. sphaeroides wild-type (WT) cells harboring the empty vector pIND5sp (Ctrl/WT) and CL3 cells expressing CL synthase from cls-pIND5sp (Cls/CL3). Each datum point was determined by imaging 300 cells by phase-contrast bright-field microscopy and using ImageJ to determine cell width and length. Shown are mean values ± standard deviations. (B) Levels of CL in R. sphaeroides WT cells harboring the empty vector pIND5sp (Ctrl/WT) and CL3 cells expressing CL synthase from cls-pIND5sp (Cls/CL3). Each datum point was determined from a TLC plate by densitometry with ImageJ. Shown are mean values ± standard deviations obtained from three independent experiments. (C) Quantification of biofilms formed by R. sphaeroides WT cells harboring the empty vector pIND5sp (Ctrl/WT) and CL3 cells expressing CL synthase from cls-pIND5sp (Cls/CL3). Biofilms were grown on a polystyrene microtiter plate for 72 h at 30°C in Sistrom's succinate medium and then stained with CV. The extent of biofilm formation was determined by measuring the absorbance of CV at a wavelength of 550 nm. Shown are mean values ± standard deviations obtained from three independent experiments, each performed in eight replicates. (D) Growth curves of R. sphaeroides WT cells harboring the empty vector pIND5sp (Ctrl/WT) and CL3 cells expressing CL synthase from cls-pIND5sp (Cls/CL3). Cells were grown in Sistrom's succinate medium in glass test tubes at 30°C with shaking. Shown are mean values ± standard deviations obtained from three independent experiments.
