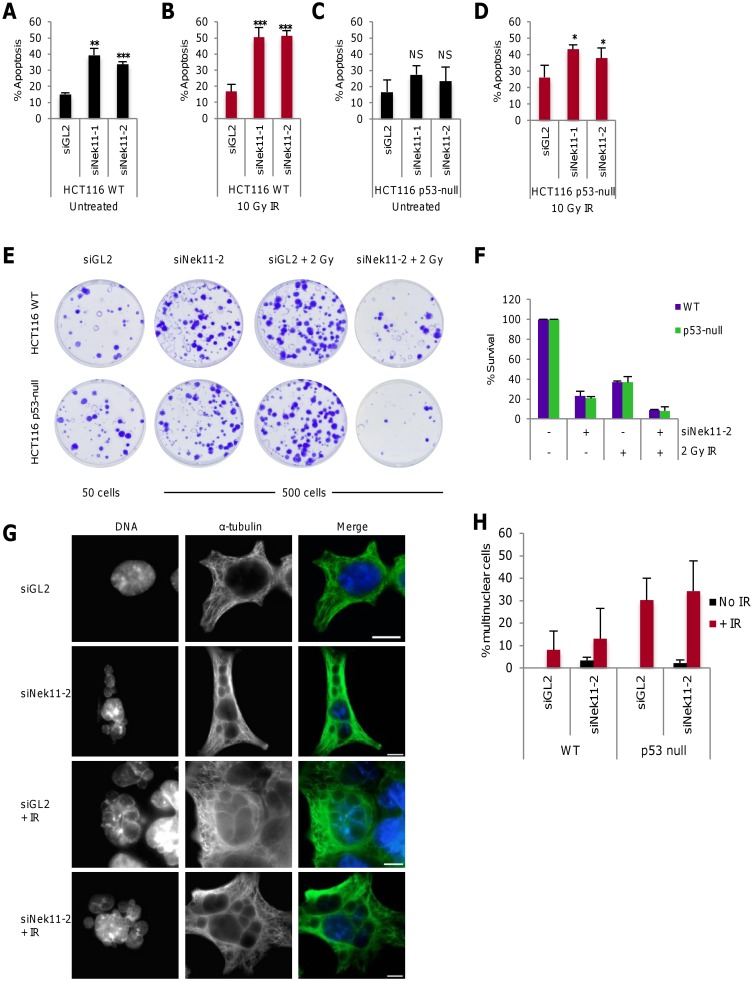
Fig 2. Nek11 depletion leads to apoptosis and loss of cell viability.
A-D. Following the protocol described in Fig 1A, HCT116 WT (A, B) and p53-null (C, D) cells were transfected with siRNAs as indicated, before irradiation and analysis by annexin V-based flow cytometry. Histograms represent the percentage of all cells in apoptosis. p values are relative to siGL2. E. HCT116 WT and p53-null cells were transfected with siRNAs as indicated and after 56 hours treated ±2 Gy IR. Cells were collected after a further 16 hours and plated for clonogenic assays (50 cells per plate for siGL2, 500 cells per plate for other treatments). Colonies were stained with crystal violet. F. Colonies from E were counted and % survival determined as described in Materials and Methods. G. HCT116 p53-null cells were transfected with either siGL2 or siNek11-2 and after 56 hours either left untreated or irradiated. Cells were fixed 48 hours post IR and stained with α-tubulin antibody (green). DNA was stained with Hoechst to observe nuclear morphology. Scale bars, 10 um. H. Histogram represents the percentage of cells exhibiting multiple nuclei following the treatments indicated as described in G. 500 cells were counted per sample and the average percentage of multinuclear cells was determined across two independent experiments.

