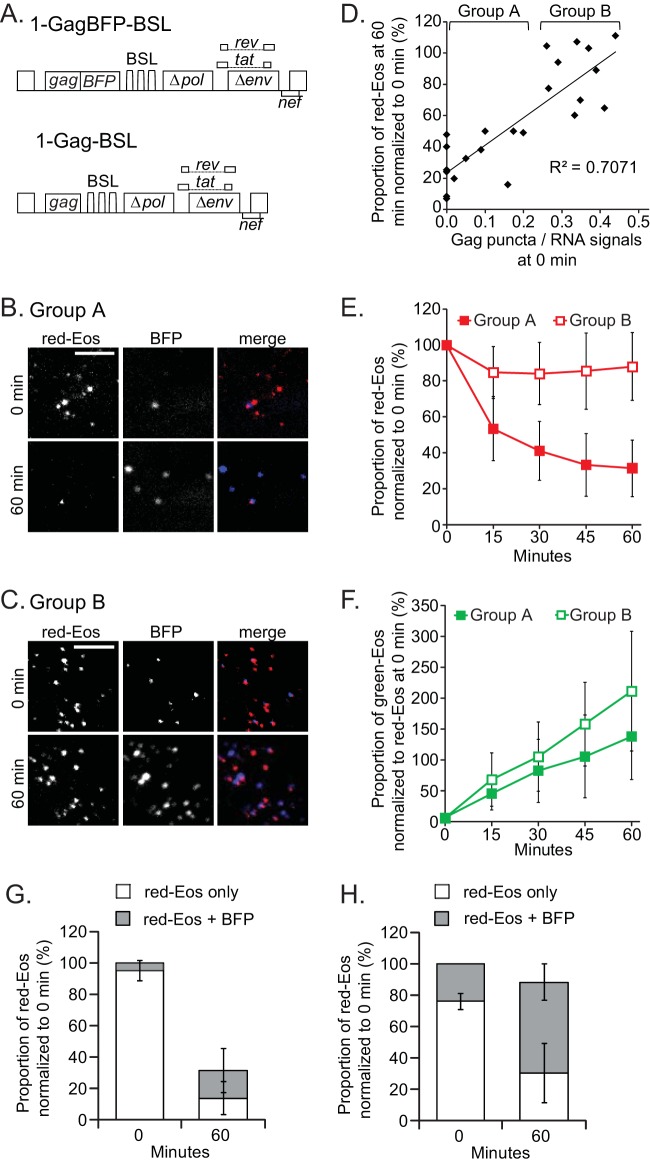
FIG 4.
Effects of Gag on HIV-1 RNA dynamics near the plasma membrane. (A) General structures of the HIV-1 constructs used in this study. Images of representative cells that had lost more RNA signals (B) or fewer RNA signals (C) at 60 min are shown. Only a region of each cell is shown. Bars, 5 μm. (D) Correlation between RNA retention and the ratio of Gag to RNA at the 0-min time point. Each solid diamond represents a datum point for one cell. The data for 23 cells are summarized. For analysis and discussion, these cells were separated into two groups, A and B, as indicated. (E) Dynamics of red-Eos-labeled HIV-1 RNAs of groups A and B. The results for group A, summarized for 13 cells, are shown as solid squares, whereas the results for group B, summarized for 10 cells, are shown as open squares. (F) Dynamics of green-Eos-labeled HIV-1 RNAs of groups A and B. The average photoconversion efficiency for these experiments was 94%. The proportions of red-Eos (RNA) signals associated with BFP (Gag) signals were summarized for cells in group A (G) and group B (H). Open bar, red-Eos signal without an observable BFP signal; gray bar, red-Eos signal colocalized with a BFP signal. Error bars show standard deviations.

