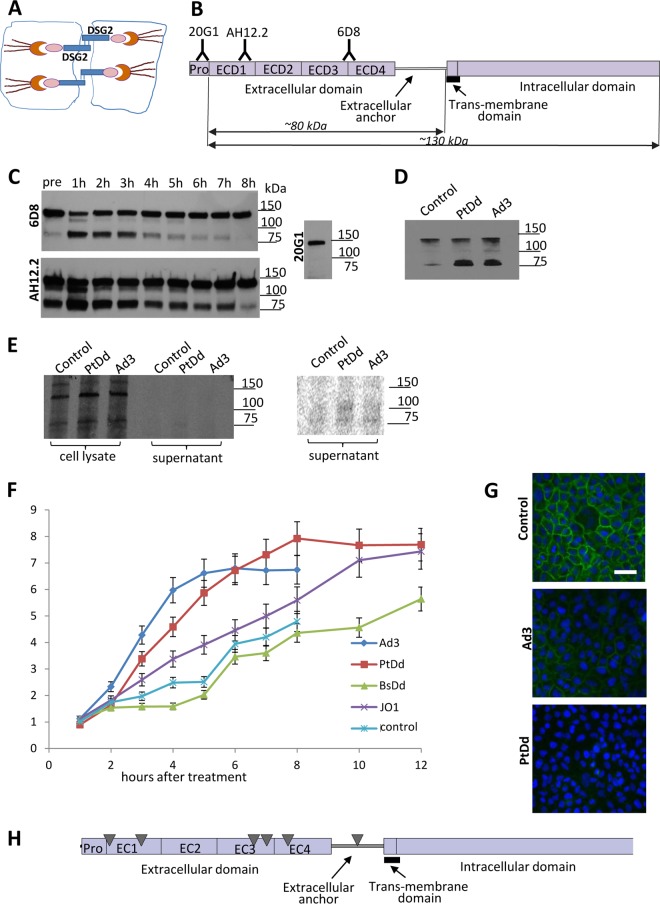
FIG 1.
DSG2 shedding in vitro in tissue cultures. (A) DSG2 is localized in desmosomal junctions at the lateral side of epithelial cells. The extracellular domain of DSG2 forms a homodimer between two neighboring cells. On the cytoplasmic side, DSG2 binds to cytoskeletal proteins such as plakoglobin, plakophilins 1 to 4, and the intermediate filament binding protein desmoplakin. The desmin/keratin intermediate filaments link the DSG2 transmembrane protein complex to the cell membrane. (B) Structure of DSG2. The extracellular part of DSG2 contains four domains (ECD1 to ECD4), followed by an extracellular anchor domain, the transmembrane domain, and the intracellular domain. Monoclonal antibodies (20G1, AH12.2, and 6D8) against different ECDs are listed. The predicted molecular masses of the cell-associated and shed portion of DSG2 are indicated. (C) DSG2 Western blot of cell lysates using anti-DSG2 MAbs. Confluent lung cancer A549 cells were treated with Ad3 at an MOI of 200 PFU/cell. Cells were collected at different time points and subjected to Western blotting with anti-DSG2 MAbs 6D8, AH12.2, and 20G1. Molecular mass makers are shown on the right side of the blots. The full-length DSG2 band runs at a molecular mass of ∼130 kDa. A dominant small band at ∼80 kDa is detected with 6D8 and AH12.2 MAbs but not with MAb 20G1. (D) DSG2 immunoprecipitation/Western blotting of cell supernatants. A549 cells were incubated with Ad3 (200 PFU/cell) or PtDd (1 μg/ml). Culture supernatant was collected 4 h later, and shed DSG2 was pulled down using 6D8 antibodies/protein A/G-agarose. Pulled-down proteins were analyzed by Western blotting with 6D8 antibodies. (E) Metabolic labeling for detection of de novo-produced DSG2 in cell lysates and culture supernatant. Cells were exposed to Ad3 and PtDd as described for panel E in the presence of [35S]methio nine-serine for 2 h, followed by a 2-h incubation in chase medium. Cell lysates and supernatant were immunoprecipitated with anti-DSG2 6D8 antibody/protein A/G-agarose and separated by polyacrylamide gel electrophoresis. The right panel shows a phosphorimager exposure of the supernatant signals. (F) Concentration of DSG2 in supernatant of A549 cells measured at different time points by ELISA. A549 cells were treated with Ad3 virus (200 PFU/cell), purified recombinant penton-dodecahedral particles (PtDd) or penton base-dodecahedral particles (BsDd) (1 μg/ml). Culture supernatant was collected at the indicated time points and used for ELISAs. Shown is the relative increase in DSG2 levels compared to pretreatment (time point 0) levels (n = 3). The differences in results for BsDd versus the untreated cells (control) (at all time points), for Ad3 versus PtDd at 8 h, and for PtDd versus JO1 at 8 h were not significant. For results with Ad3 versus those with the control at 8 h, P < 0.01; for PtDd results versus those with BsDd at 12 h, P < 0.01. In Ad3-treated samples, the first signs of cytopathic effect were observed at 6 h. (G) Immunofluorescence analysis of A549 cells. Six hours after the addition of Ad3 (200 PFU/cell) or PtDd (1 μg/ml) cells were stained with fluorescein isothiocyanate-labeled 6D8 antibody. DSG2 signals are green. Scale bar, 50 μm. Note that the immunofluorescence analysis was performed on nonpermeabilized cells and therefore does not detect DSG2 that is not presented on the membrane. (H) Results of tandem mass spectrometry analysis of shed DSG2. A549 cells were incubated with PtDd as described for panel D. Eight hours later, shed DSG2 was pulled down using 6D8 antibodies. Pulled-down proteins were then subjected to MS/MS. The triangles indicate the top peptides identified by MS/MS.

