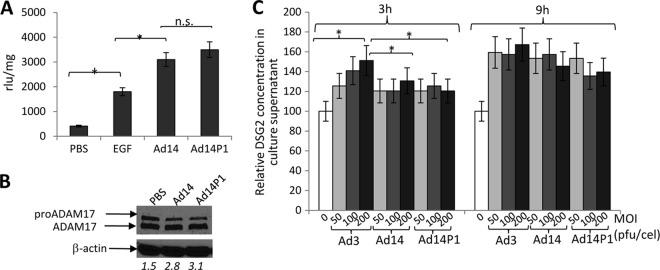
FIG 12.

Intracellular signaling and DSG2 shedding triggered by Ad14 and Ad14P1. (A) SRE/MAPK reporter analysis of MAPK activation by Ad14 and Ad14P1. The conditions were as described in the legend of Fig. 5D. (B) Activation of ADAM17. A549 cells were incubated with Ad14 or Ad14P1 virus (MOI of 200 PFU/cell). ADAM17 was analyzed by Western blotting as described in the legend of Fig. 6A. The number below each lane is the ratio of the signal from the ADAM17 band to that from the pro-ADAM17 band. (C) DSG2 shedding triggered by Ad14 and Ad14P1 virus. A549 cells were exposed to Ad3, Ad14, and Ad14P1 at the indicated MOIs as described in the legend of Fig. 1F. Shown are relative DSG2 concentrations in the culture supernatant at 3 and 9 h. Pretreatment levels were taken at 100% (n = 3). *, P < 0.05; ns, not significant.
