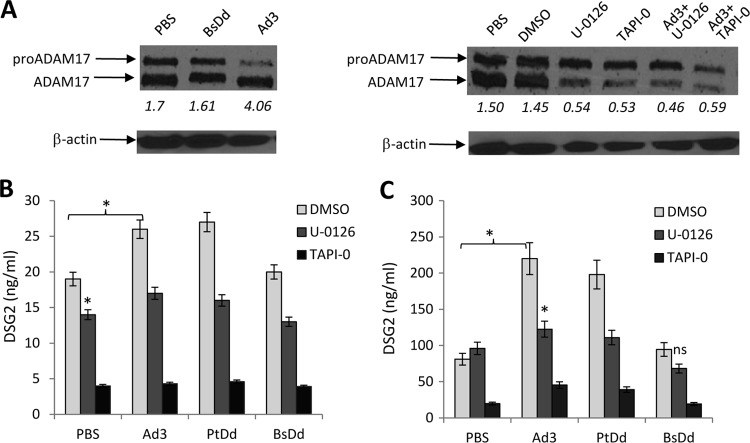
FIG 6.
Inhibition of DSG2 shedding by MAPK and ADAM17 inhibitors. (A) Analysis of ADAM17. The left panel shows activation of ADAM17. A549 cells were incubated with BsDd (1 μg/ml) (as a negative control) or Ad3 virus (MOI of 200 PFU/cell). Cells were washed once with PBS at 11 h after incubation, lysed, and subjected to Western blotting with polyclonal anti-ADAM17 antibodies. The arrows indicate pre-ADAM17 and the processed form of ADAM17. Pixel densities of bands were measured by GE Healthcare's ImageQuant software. The numbers below each lane are the ratios of signals from the ADAM17 band to signals from the pro-ADAM17 band. The right panel shows the inhibition of ADAM17 by the ADAM17 inhibitor TAPI-0 (final concentration, 50 μM) or the MAPK inhibitor U-0216 (final concentration, 10 mM), added alone or together with Ad3 virus. Cells were harvested 11 h later. Dimethyl sulfoxide (DMSO) is a solvent for both inhibitors and was therefore used as a control. β-Actin served as a loading control. (B) DSG2 concentrations in A549 culture supernatant. Culture supernatant was collected 11 h after treatment, and DSG2 concentrations were measured by ELISA (n = 3). *, P < 0.01. (C) DSG2 concentrations in SKOV3 cell culture supernatants. Cells were treated as described for panel C. The differences in the amounts of shedding triggered by PBS, Ad3, PtDd, and BsDd in the presence of TAPI-0 in SKOV3 cells were not significant.

