
Figure 10.
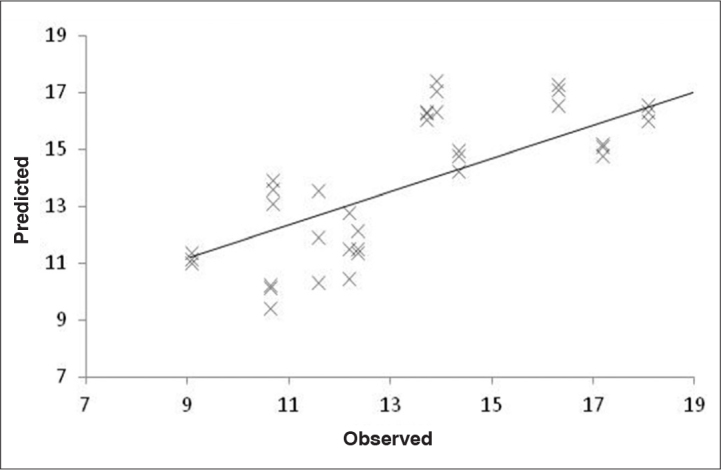
Regression line built using observed and predicted values for protein oxidative stress CO. CO calibration needed 2 latent variables to capture the main sources of variations. Those calibrations are associated with reasonable calibration/prediction errors. For CO groups, a predictive power with a correlation of 0.70, a relative RMSECV of 17.2%, and RMSEP of 19.1% were obtained